31 October 2022
A question we have heard several times from clients has been: when will equity analysts get as bearish as investors have been recently? Well, analysts may be getting closer to that point now, particularly for the large-cap US stocks that dominate the cap-weighted indices.
That is, stock prices have been falling most of the year and investors are very bearish, and now it looks like analysts are “catching up” and more aggressively cutting their earnings estimates.
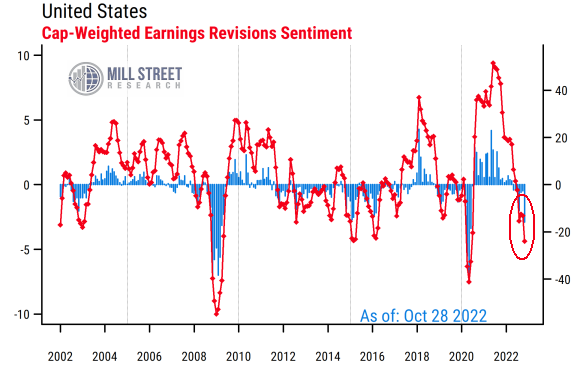
The chart below shows our aggregated indicators for analyst behavior for our broad US stock universe, but is calculated on a cap-weighted basis. That means the readings are tilted toward the mega-cap stocks that make up a greater proportion of total market value, and drive most of the cap-weighted market indices.
 Source: Mill Street Research, Factset
The red line shows the net proportion of analysts who are raising versus lowering their earnings forecasts for the next 12 months, what we refer to as “revisions breadth”. So the current reading of about -25% means that out of 40 analysts covering a hypothetical mega-cap stock, 15 might be raising estimates while 25 are cutting them, leaving a net -10 out of 40, or -25%.
The blue bars show the monthly average percent change in the forward 12 month estimates, what we call “revisions magnitude”. The latest reading of -2.9% says analysts have cut estimates by that amount on a cap-weighted average basis, which is a relatively large amount relative to historical norms (most blue bars on the chart are not that negative). The monthly magnitudes are naturally more volatile than the breadth readings, and help complete the picture of “how many” analysts are changing estimates and “how much” they are changing them.
The latest readings stand out as being at or near the lowest (most negative) levels since the short but severe burst of estimate cuts in Q2 of 2020 when COVID first hit.
The current readings are also at or slightly worse than the readings during the global slowdown in 2015-2016, but not nearly as severe as the 2008-09 readings.
Of course, it bears remembering that the current negative readings follow on the heels of all-time record high readings in 2020-21 as recovery from COVID and massive fiscal and monetary stimulus provoked a surge in corporate earnings and the corresponding boosts to earnings forecasts.
Now that monetary policy is being tightened aggressively and fiscal support has fallen sharply, the economy is slowing, the US dollar has appreciated dramatically, and prices/inflation have been volatile. Analysts are responding by reducing earnings forecasts, in part due to narrowing profit margins from their earlier extreme high levels.
The net result is that analyst sentiment is now quite negative, though not at historically extreme levels seen in true crisis periods. This puts analysts more in line with investor sentiment readings, which have shown high levels of pessimism in recent months. While broad-based estimate cuts are a potential headwind near-term, contrarian-minded investors will tend to look for such potentially extreme readings for opportunities to buy when others are fearful (and presumably sell when others are overconfident).
Where are analysts cutting estimates most and least?
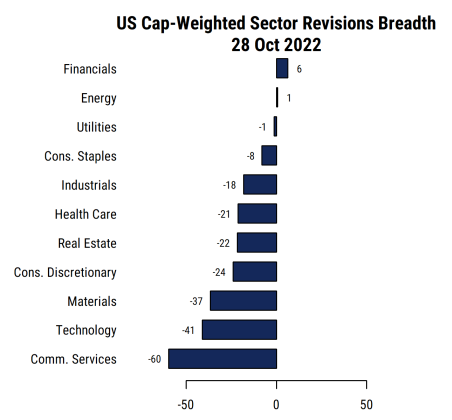
Breaking our US revisions breadth metrics into sector aggregates, we see that most sectors are seeing net negative revisions, but with a wide range. On a cap-weighted basis, only the Financials sector has a noticeably positive breadth reading, while Utilities and Energy are essentially zero (i.e., positive and negative revisions are evenly balanced). Thus those sectors, along with Consumer Staples, are the relative outperformers based on cap-weighted earnings estimate revisions right now.
 Source: Mill Street Research, Factset
At the bottom of the list we see Communication Services as the weakest by far. This sector, heavily weighted toward companies like Meta (META), Alphabet (GOOG/GOOGL), and Netflix (NFLX), has had below-average revisions for a year now and is showing no signs of improvement. The latest earnings reports from Meta and Alphabet were received poorly and have done little to turn the negative tide among analysts in the sector.
Materials and Technology are the other two sectors that are weaker than average right now. Materials is being weighed down by declines in many of the commodities the sector produces, including industrial and precious metals, as tighter US monetary policy along with weakness in China has had a strong impact in the sector.
Technology revisions have been under pressure in recent months (since late July in our work) after a long period of above-average analyst activity. Some of the big-cap Technology names benefited from COVID-driven behavior by companies and consumers, and are now seeing those tailwinds reverse. Some also added headcount and costs too aggressively and are having to step back now in the face of easing demand.
Equal-weighted revisions show a somewhat different picture
The data above is all based on cap-weighted aggregates of revisions indicators, giving more weight to the largest stocks. But one risk from such calculations is that idiosyncratic events at one or two very large companies (e.g. building a very expensive “metaverse”) can skew the picture of the overall sector. So we often use equal-weighted metrics to avoid this issue and get a clearer picture of the “average company” within the market or each sector.
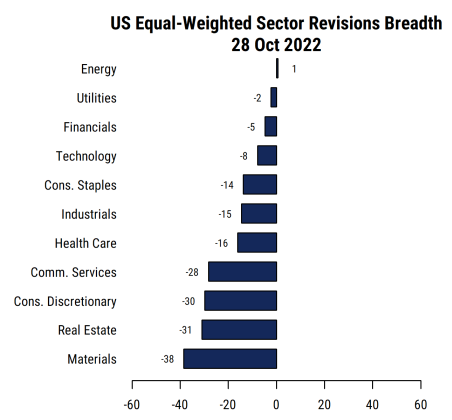
The chart below shows the same sector breakdown using equal-weighted averages of the revisions breadth of stocks in each sector (from the same 2000-stock US universe we track).
 Source: Mill Street Research, Factset
The overall negative picture is still clear, as all sectors have negative net revisions breadth except Energy, which is neutral. And the top three sectors in the cap-weighted chart are also the top three here, though in a different order: Energy is slightly ahead of Financials here.
But some sectors look notably different. Technology is ninth out of 11 sectors on a cap-weighted basis, well below average, but is fourth on an equal-weighted basis and above the overall US average. This means that the average Tech stock in the US is holding up significantly better than the mega-cap leaders on earnings revisions right now. And even Communication Services looks less bad on an equal-weighted basis: it is still below average, but only moderately so, and no more than Consumer Discretionary or Real Estate. On this version, Materials is the weakest sector, though the difference between it (-39%) and the top sector (Energy at 1%) is notably smaller (at 40%) than the corresponding 66% gap between the top and bottom sectors on the cap-weighted revisions.
The bottom line is that analysts are biased toward reducing estimates in almost all sectors, but to widely varying degrees. Financials, Utilities, and Energy are relatively strongest whether viewed on a cap-weighted or equal-weighted basis, while the weakest sectors vary depending on the weighting scheme, though Materials is clearly weak on both.
If the US economy is going into a severe recession or crisis (e.g. 2008 or early 2020), then analysts could certainly get more negative. But if there is only a mild recession or even just a bumpy slowdown, analysts are already fairly pessimistic now. This puts them more in line with the recent sentiment readings on investor/strategist surveys that have showed a roughly 2-to-1 ratio of bears to bulls in recent weeks. Contrarians looking for extremes in sentiment are seeing more evidence of that, but extremes tend to be hard to identify in real-time and appear clearly only in hindsight. Much depends on monetary and fiscal policy, which remains highly uncertain but may also be seeing signs of extreme pessimism (i.e., projections of ever-higher Fed policy rates).