As we discussed in our last commentary, analysts continue to raise earnings estimates broadly as companies keep beating consensus expectations. Expectations of additional fiscal spending and ongoing easy monetary policy along with progress toward re-opening of the economy are key macro drivers, while certain sectors such as Energy and Financials which had been areas of weakness in pre-COVID and immediate post-COVID times are now contributing more positively to the earnings outlook. This is true in the US and also globally.
Within the strong headline aggregate earnings figures, the strength in earnings reports has been led by cyclical sectors, and those areas have maintained their strong dominance over defensive sectors in our global estimate revisions breadth measures. This is feeding through to the relative performance of cyclical sectors versus defensive sectors globally.
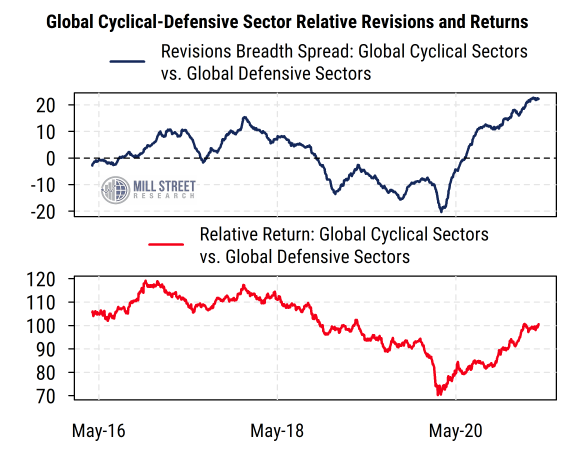
The top section of the chart below shows our aggregated sector earnings estimate revisions indicators for global cyclical sectors (Energy, Materials, Industrials, Consumer Discretionary) relative to global defensive sectors (Utilities, Real Estate, Consumer Staples, Health Care). We build these indicators in two steps. First, we use earnings estimate revisions breadth readings (i.e., the proportion of analysts raising versus lowering estimates for earnings over the next 12 months for each stock) to build equal-weighted aggregate revisions readings for each of the 11 GICS sectors using our broad (6000-stock) global stock database. Then, we create an average of the sector-level readings for the four cyclical sectors and the four defensive sectors, and calculate the rolling difference between those two averages. That difference is what is plotted in the blue line in the chart, such that readings above zero indicate cyclical sectors having stronger estimate revisions than defensive sectors, and readings below zero pointing to defensive sectors having stronger revisions globally.
 Source: Mill Street Research, Factset
We see that cyclical sector revisions have been above those of defensives since the middle of last year, and the spread has continued to widen. The latest readings are at historic highs in favor of cyclical sectors (since at least 2003) and so far are showing no signs of a turn.
The bottom section of the chart shows the relative performance of cyclical sectors versus defensives. It is based on a similar aggregate index of stock returns in each global GICS sector, then aggregating the returns for cyclical sectors and defensive sectors and plotting the relative performance.
The rising red line in recent months indicates that cyclical sectors are outperforming defensive sectors on a global basis (using equal-weighted returns). And again, there is no sign yet of a turn in the relative performance trend. Notably, the upturn that started last year came after a period of several years of underperformance by cyclical sectors, so there is reason to think that the performance trend could continue a while longer.
Overall, while the recent revisions tilt toward cyclicals is extreme by historical standards, so is the amount of stimulus and the economic rebound from last year’s COVID-driven recession. Thus it could continue a while longer, and shows no signs of turning just yet.