The NASDAQ-100 Index (often known by its ticker symbol, NDX), home to many of the mega-cap Tech-related Growth stocks that have dominated the US stock market this year, has seen some corrective action this month. A common question we hear is: is the correction enough to say the NDX is no longer “stretched” after its historic surge through the end of August?
The chart below provides some context. For four different indices, it plots the percentage difference between the current index level and its 200-day moving average, a common measure of the longer-term trend. Excessive deviations from the 200-day average are often viewed as signals of extreme investor behavior that are likely to revert back toward the average.
The chart includes the NASDAQ-100 (NDX) along with other major indices that do not include the mega-cap US Growth stocks that influence the NDX: the Russell 1000 (large-cap) Value index (“R1K Value”), the Russell 2000 small-cap index (“R2K”), and the MSCI All-Country World Excluding US Index (“ACWI Ex-US”).
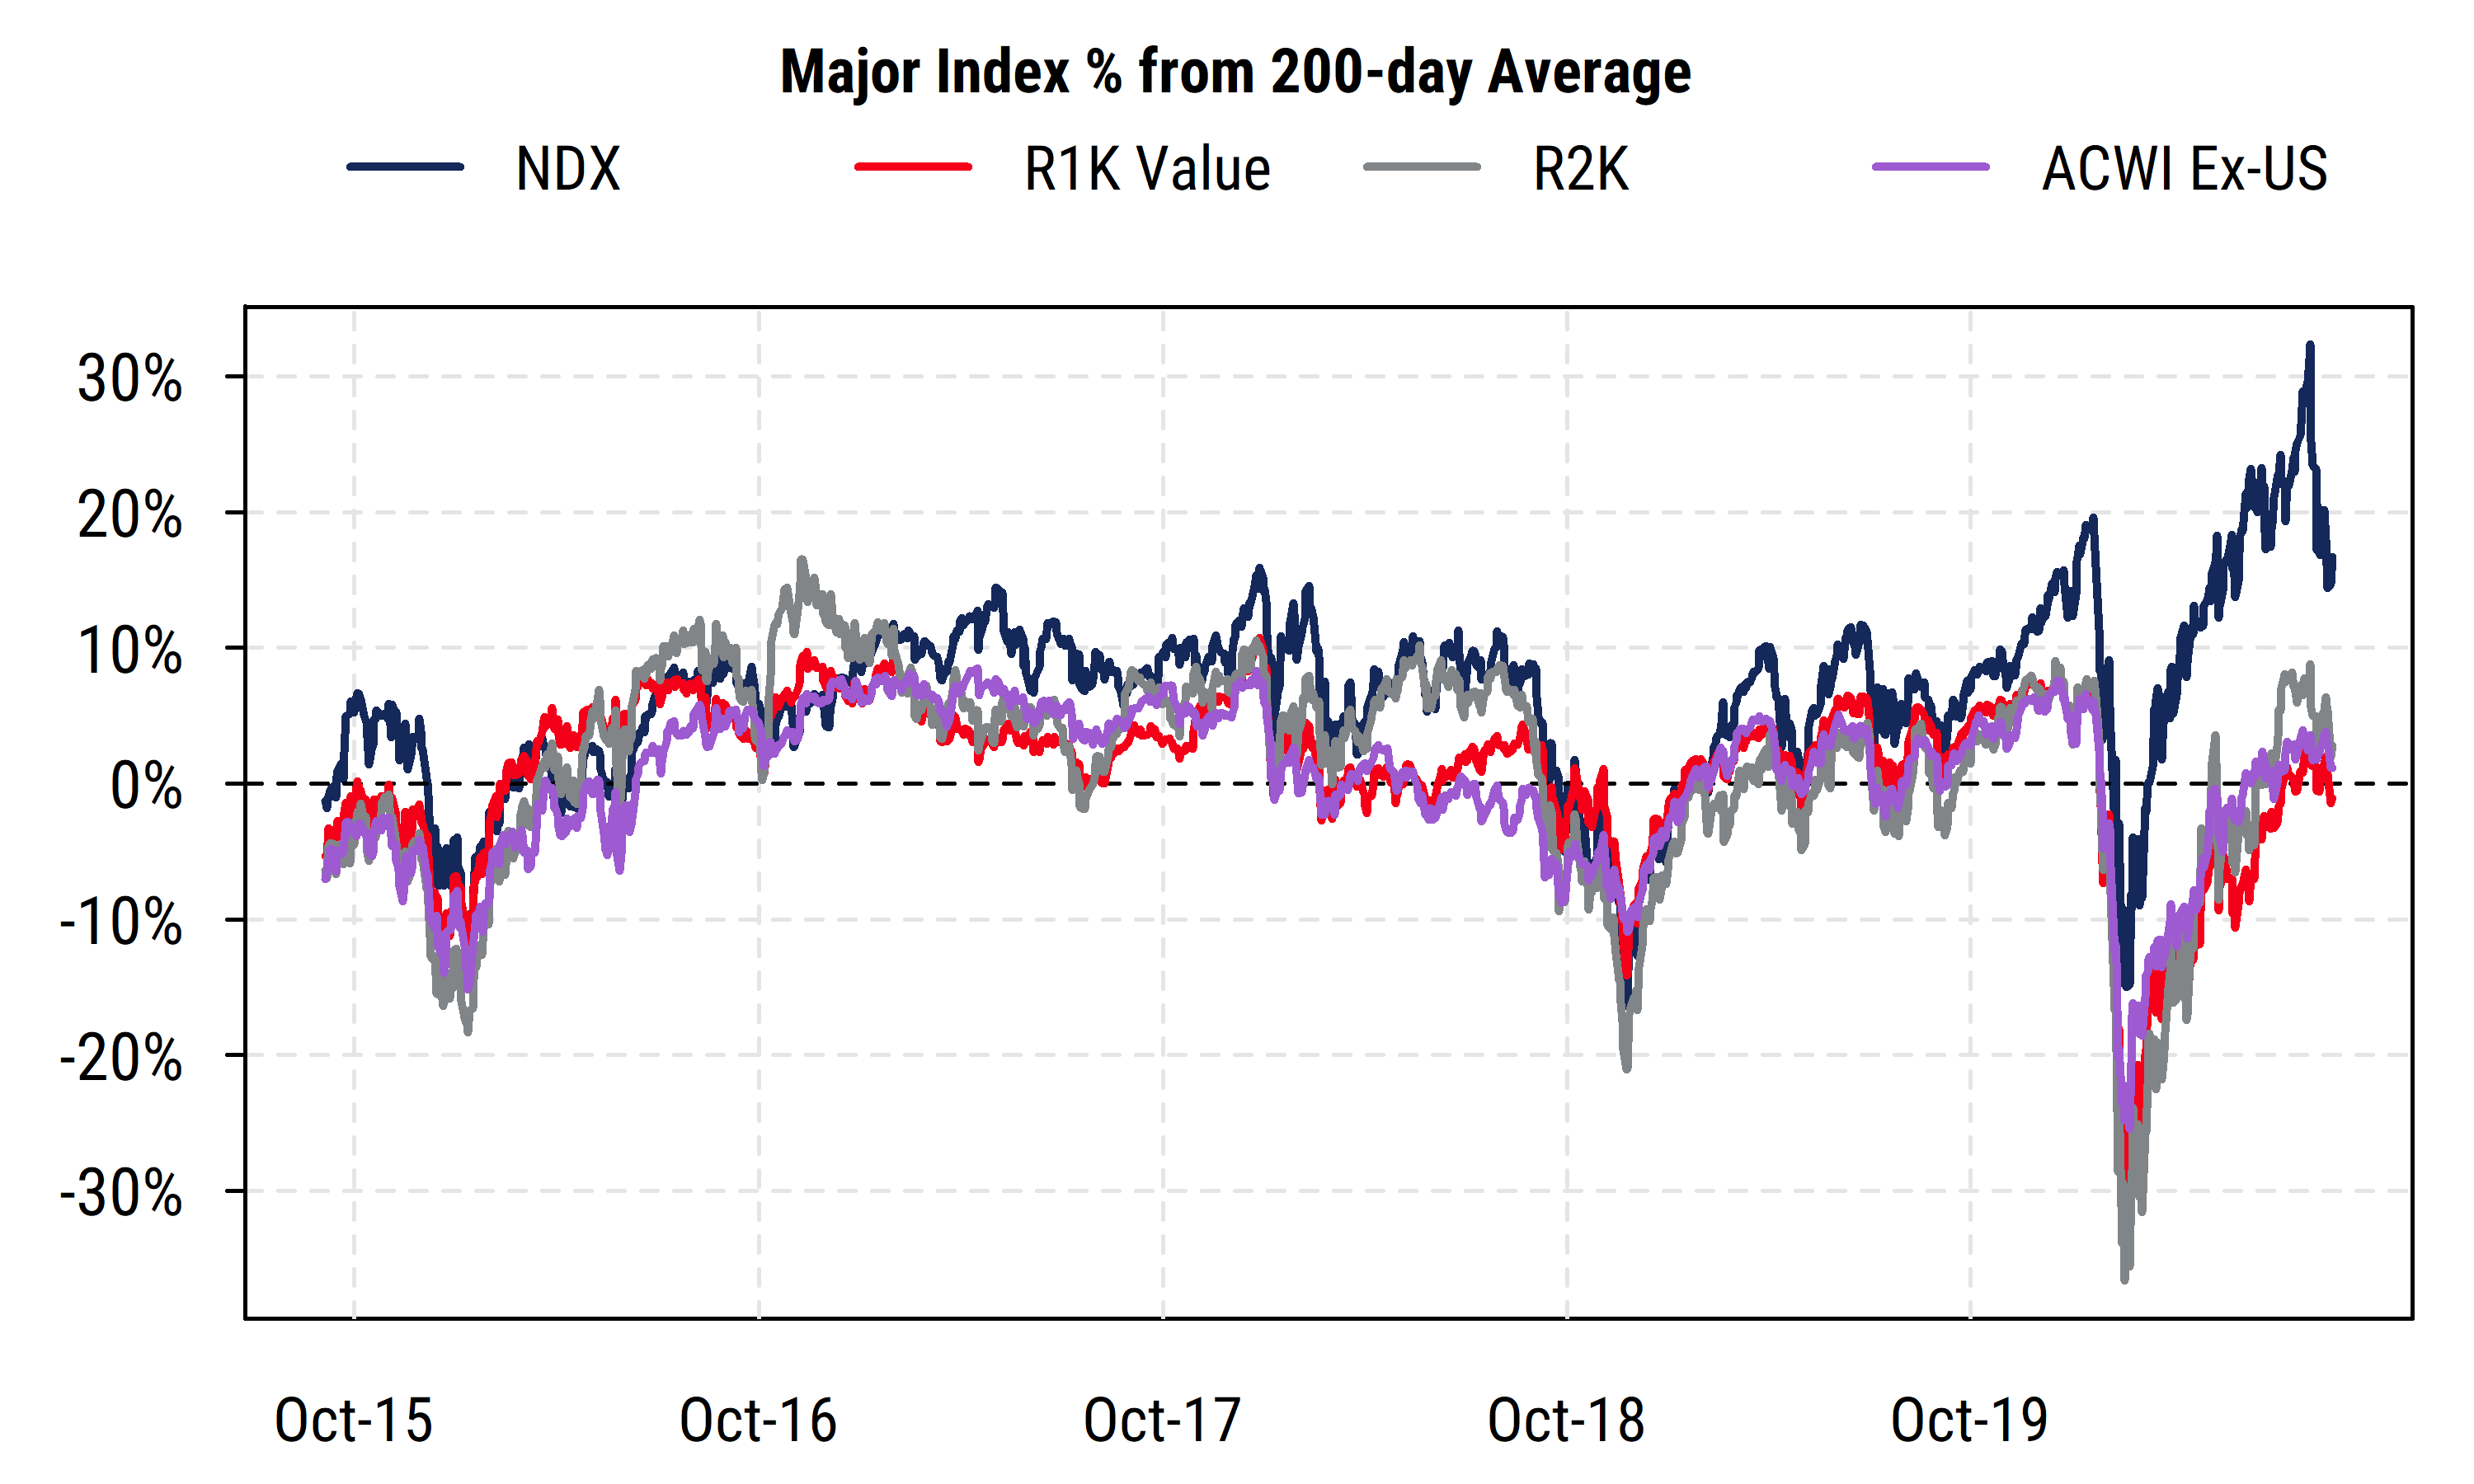
For much of the last 5 years, all of these indices typically traded within a range of +/- 10% of their 200-day average, with outlier declines visible in early 2016, late 2018, and of course March 2020. Movements of more than 10% above the 200-day average were relatively rare, at least until early 2020 and again in mid-2020 for the NDX.
Indeed, the divergence between the NDX and the other major indices became quite stark this year, and remains so today. The NDX’s surge through August brought it briefly to more than 30% above its 200-day average, an extreme reading for any major index historically. The other indices showed nothing at all similar, only recently even managing to rise above their own moving averages, and none by more than about 8% at most.
So even after a correction in the NDX of about 12% from the peak and a modest recovery, the index is still 16% above its 200-day average. That is, even after a notable correction, the index’s divergence from its longer-term trend is still sufficiently extreme that it would be considered “overbought” or excessive by normal historical standards for major indices. By contrast, as of the close of Sept. 22nd, the other three indices in the chart were within a range of 1% below to 3% above their own 200-day averages, i.e., hovering very close to their respective longer-term price trends.
This metric by itself would indicate that the NDX is still at risk of further corrective action in order to move back to a more normal distance from its 200-day average. Of course, if the fundamental earnings trends for the NDX constituents are indeed that much stronger than those of the other indices, then a persistent gap could be warranted. And it is worth remembering the “moving” part of a moving average: the gap between the index and its moving average will narrow even if the index is simply unchanged for a period of time as the moving average catches up to the current price.
Our guess would be that the “easy money” period may be over, and there will be more choppy activity that narrows the gap between the NDX and its moving average, but doesn’t necessarily result in a massive decline from recent levels. We expect fundamentals for the large-cap Tech/Growth stocks to remain attractive in relation to other areas of the market on a longer-term basis, but the excessive optimism in the NDX seen around the peak in late August needs some time to be worked off.