July 10, 2020
As Q2 earnings season gets underway, the level of uncertainty about future earnings among analysts remains extremely high. Despite somewhat calmer equity market activity recently, our data shows that the level of disagreement among analysts regarding earnings over the next 12 months (NTM) is still well above the highest levels reached in the Great Financial Crisis (2008-09) period (chart below).
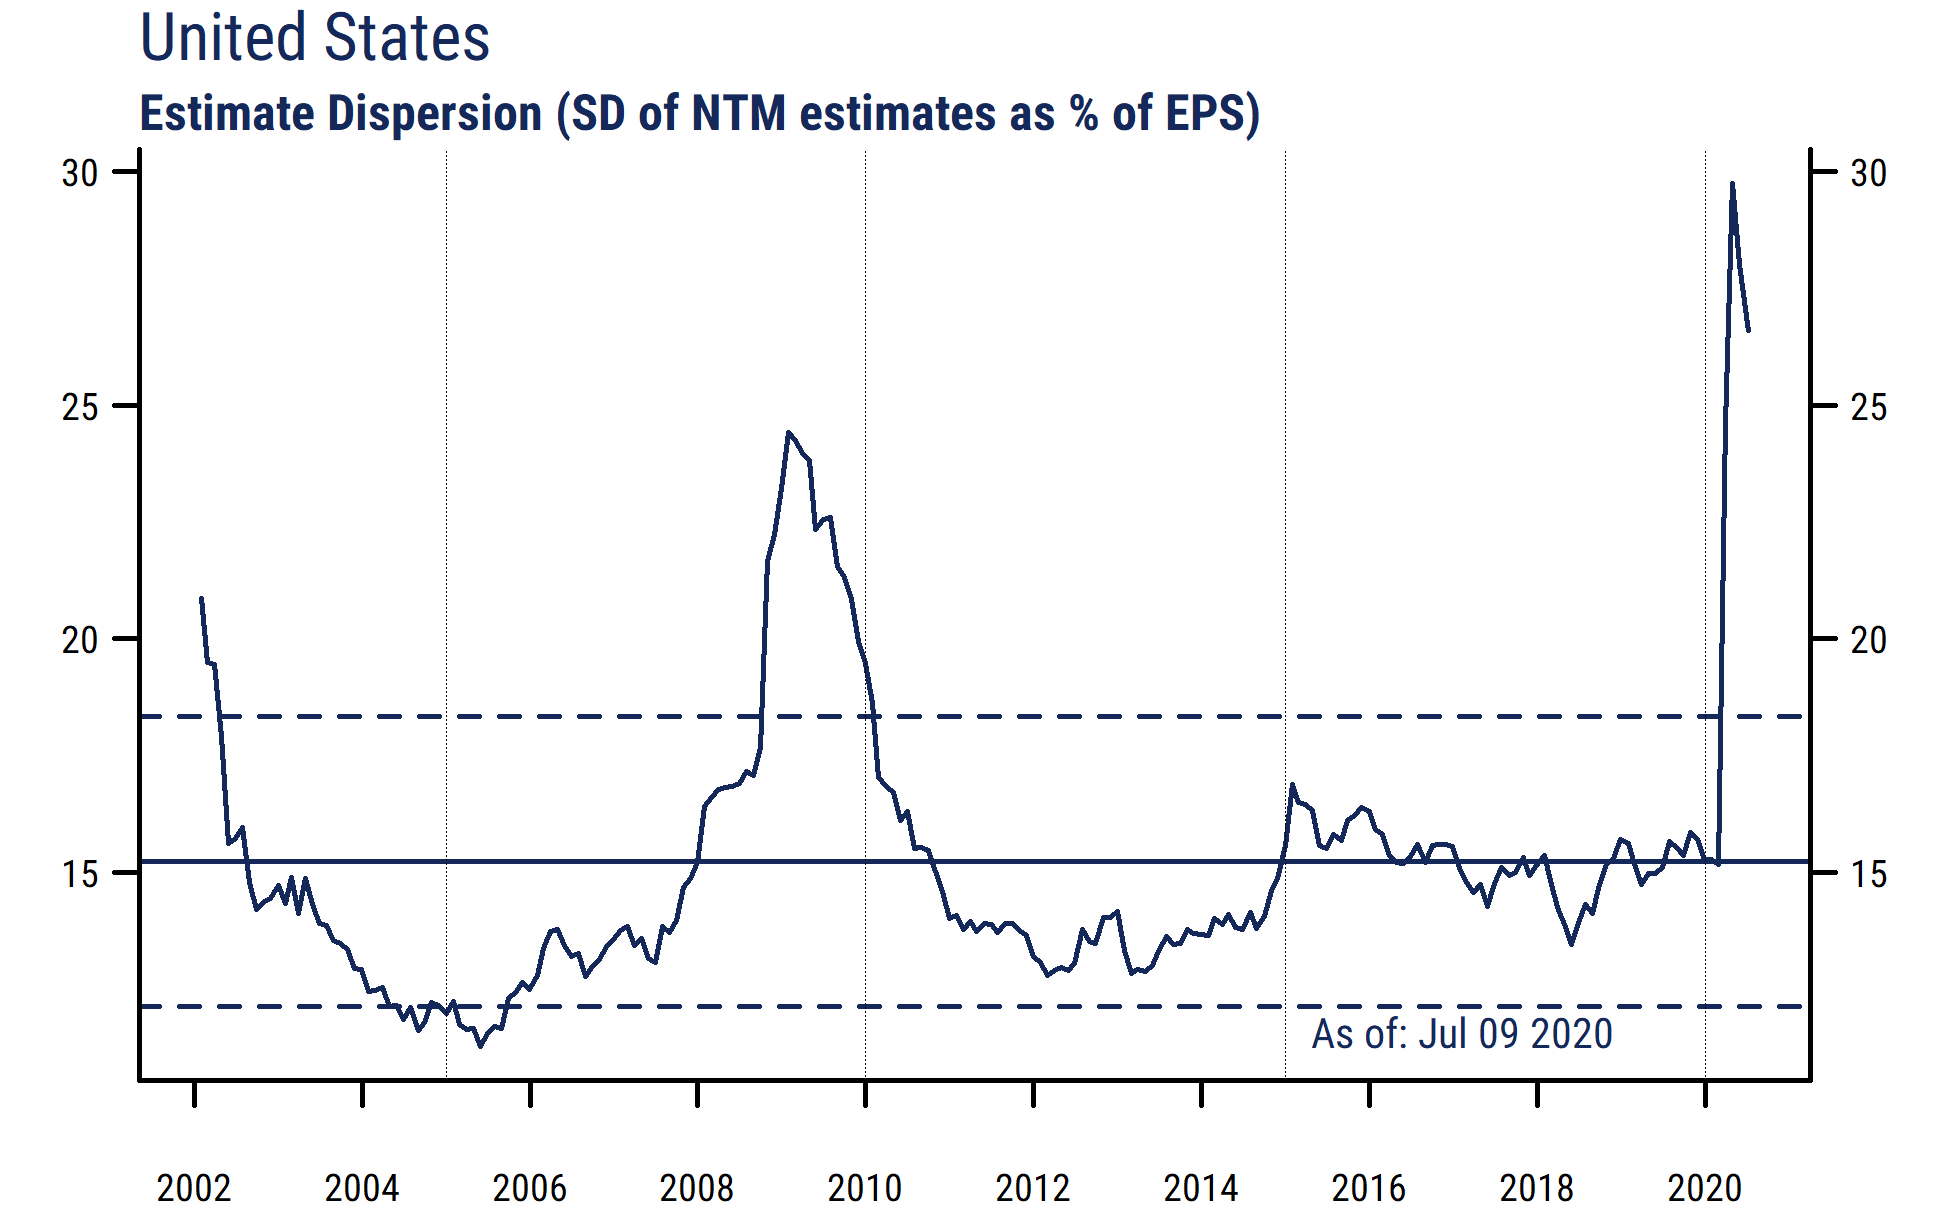
The chart plots monthly (and latest) readings for the average dispersion of analyst forecasts around the mean for US stocks (standard deviation of estimates as a percentage of the mean estimate for each stock, averaged across all stocks in our 2300-stock US universe*). A higher dispersion number indicates a wider range of estimates (more disagreement about the level of future earnings) for the average stock. The solid horizontal line is the long-run average, and the dashed lines are +/- 1 standard deviation from the average.
One reason for the extreme level of disagreement among analysts is that a record number of companies have withdrawn their usual earnings guidance in light of the uncertainty surrounding the impact of COVID-19 and related government responses.
And equity analysts, like many other workers, have also been forced to work from home and unable to travel to visit companies, attend conferences, and gather information as they normally would. So with less scope to do their own legwork and less input from company management, analysts have far less information to work with now than usual.
These limitations on information access, alongside the obvious difficulty of predicting economic activity and earnings in an unprecedented global health crisis, no doubt help explain why there is little confidence about forecasting future earnings. We might therefore expect to see a greater number of earnings surprises when companies release their results.
And while theory suggests that higher earnings uncertainty would normally prompt investors to reduce the valuations given to equities, that has not been the case recently as aggressive stimulus from central banks and government spending have in fact pushed equity valuations much higher.
*Note: our US universe includes stocks with at least three analysts covering them, a minimum $200 million market cap, and at least $2 million/day average trading volume.