28 July 2022
Yesterday’s decision by the Federal Reserve to raise rates by 75 basis points for a second consecutive time was historic, as it marks the most aggressive back-to-back rate hikes (150 basis points in less than two months) since the early 1980s, before the Fed was formally targeting the fed funds rate as its key policy focus.
The Fed’s statement and press conference yesterday clearly indicated that the Fed is not done with raising rates yet, but gave some of the first indications that they are acknowledging the signs of slowing economic growth and that the lagged effects of the rate hikes to date have not been fully felt yet. Markets reacted favorably to the news (75bps was well anticipated before the meeting), as it brings the potential for smaller rate hikes and the eventual end of the rate hike cycle closer.
Given the importance of Fed policy and expectations for markets, we track it closely and incorporate it into our key near-term (1-3 month horizon) global equity risk model.
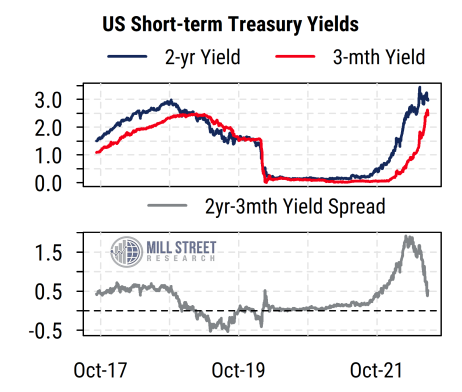
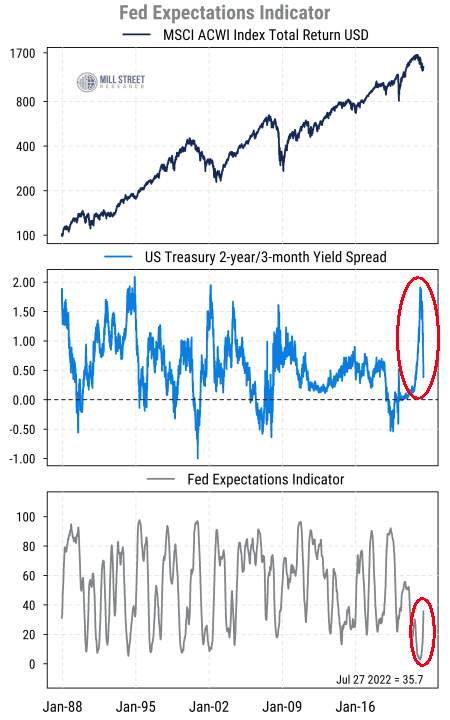
Known to clients as the Fed Expectations Indicator, it is designed to capture the powerful influence that policy actions by the US Federal Reserve have on asset markets globally, including equities. It is based on the spread between the two-year US Treasury note yield and the three-month Treasury bill yield. The bill yield closely tracks the current short-term interest rates set by the Fed, while the two-year note yield captures market expectations of where short-term rates are likely to go over the next two years.
 Source: Mill Street Research, Factset
A wider two-year/three-month spread indicates expectations of future rate increases and thus tighter monetary policy, which typically slows the economy and is therefore a negative for equity prices. A narrower spread points to fewer expected future increases, or potential rate cuts, which tend to be stimulative and thus supportive for equities.
The indicator converts the raw yield spread into a scaled reading by ranking the current yield spread within its trailing six- to 12-month range and combines the scaled components to capture the direction of recent investor expectations. Thus high indicator readings reflect a narrower yield spread and expectations of looser policy and are bullish for equities, while low readings reflect the reverse.
 Source: Mill Street Research, Factset
Our historical testing of the indicator back to 1988 suggests that it is indeed useful as a leading indicator of future equity market returns, with the standard caveat that this is the result of a backtest (i.e., this indicator did not actually exist in 1988) and not a reflection of any actual trading or investment strategy (Mill Street Research does not manage client money, we are only a research provider). As always, this is not meant as investment advice and is only one piece of information (and is only one of eight components of our model, which is itself one element in our overall analysis).
When the Fed Expectations indicator has been in its bottom quartile (the least favorable 25% of the time) historically, the S&P 500 has averaged essentially no return over the next month on average, and just 0.33% over the next 3 months, with significant variation. As a benchmark for comparison, over this period, the S&P 500 has returned just under 1% per month or a slightly less than 3% per quarter on average. The global MSCI ACWI index (shown in the chart) has shown slightly negative returns over one and three months after bottom quartile readings. That is, there has been elevated risk and no net reward to owning stocks on average when Fed worries have been high historically by this measure.
By contrast, when the indicator has been in its top quartile historically (reflecting a narrow spread between two-year and three-month Treasury yields), the S&P 500 has returned 1.48% on average over the next month, and 4.23% over the next three months (equivalent to ~17% annualized return). This reflects the more favorable influence of monetary policy when rates are expected to remain stable or decline.
The indicator had been in the bottom quartile since October 2021, and is just now shifting out of that range. This reflects the fact that the yield spreads we use in our indicator have reversed sharply as the Fed has moved closer to the perceived end of the tightening cycle.
Markets are now in the process of trying to guess when (or at what level of interest rates) the Fed will in fact end its tightening process and shift to a neutral or more accommodative stance. Current expectations point to a shift in the first half of next year, but with significant uncertainty still, especially given that Fed Chair Jerome Powell seemed to suggest there will be less explicit guidance on near-term rate movements going forward as policy becomes more data dependent.
The “light at the end of the tightening tunnel” has helped stocks to stabilize and rebound recently. As the Fed becomes less of a headwind, investor worries will likely continue to focus on whether economic and earnings growth will slow too much, or if a “soft landing” can be achieved while bringing inflation down.