Much of the attention in equity markets has been focused on the Technology sector, many of whose constituents are reporting Q2 earnings now. The Technology sector has outperformed dramatically both in the US and globally in recent years as well as for the year-to-date. This has raised questions about whether the sector is “overowned” and overvalued, particularly given its unusually high weighting in the S&P 500 index now.
While it may seem almost a foregone conclusion that after extraordinary outperformance the sector must be overvalued, our data suggest this is not necessarily the case. We review a couple of interesting charts below, focusing on relative returns and valuations (not absolute valuations).
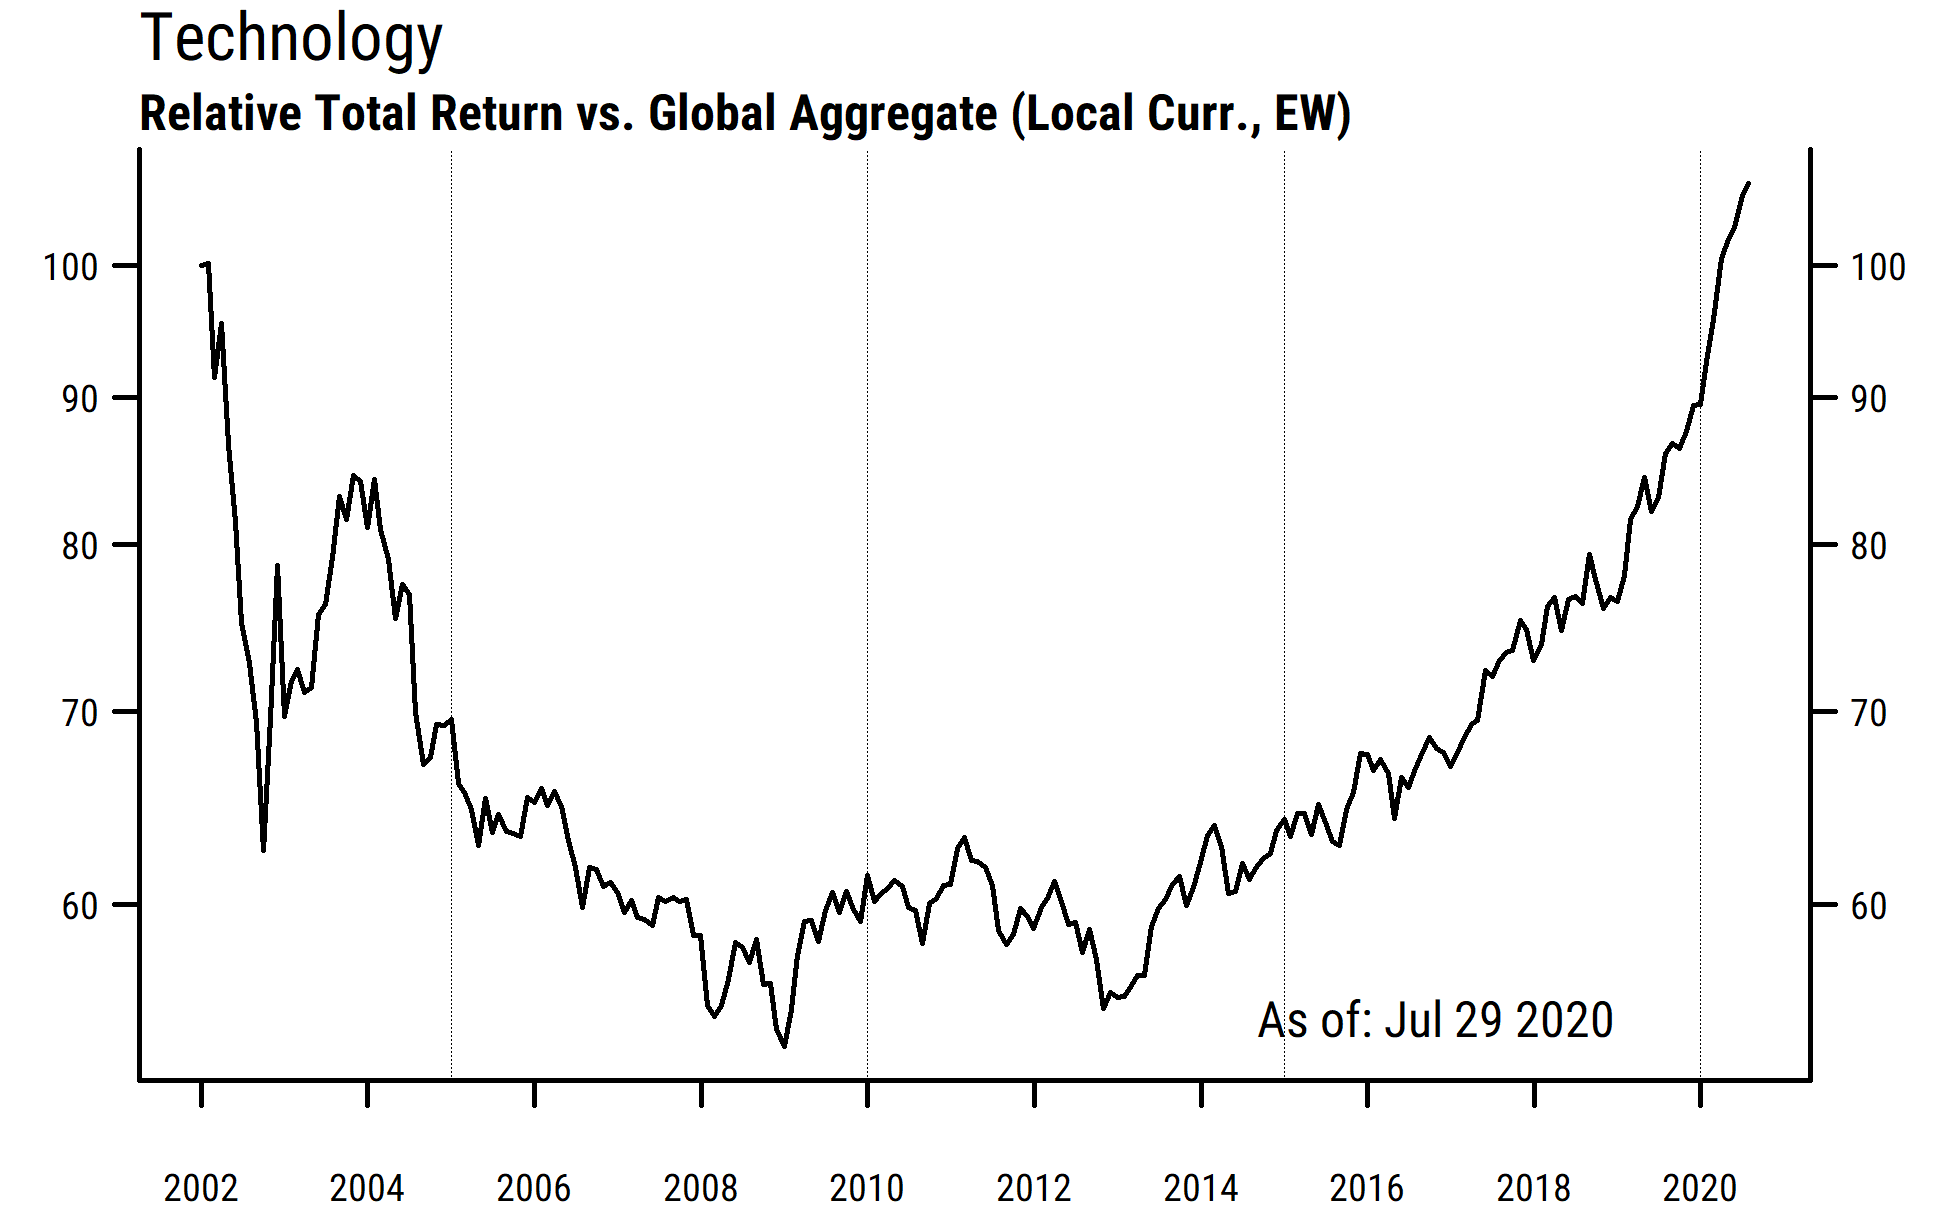
- Tech stocks have indeed outperformed globally, extending a long-term trend in place for seven years and counting now. The chart above shows the relative return of global Technology stocks in our stock universe relative to the return of the entire global universe (~6000 stocks currently). The returns are calculated on an equal-weighted basis (to avoid the potential distortions of a few mega-cap stocks), though the trends using cap-weighted returns look similar.
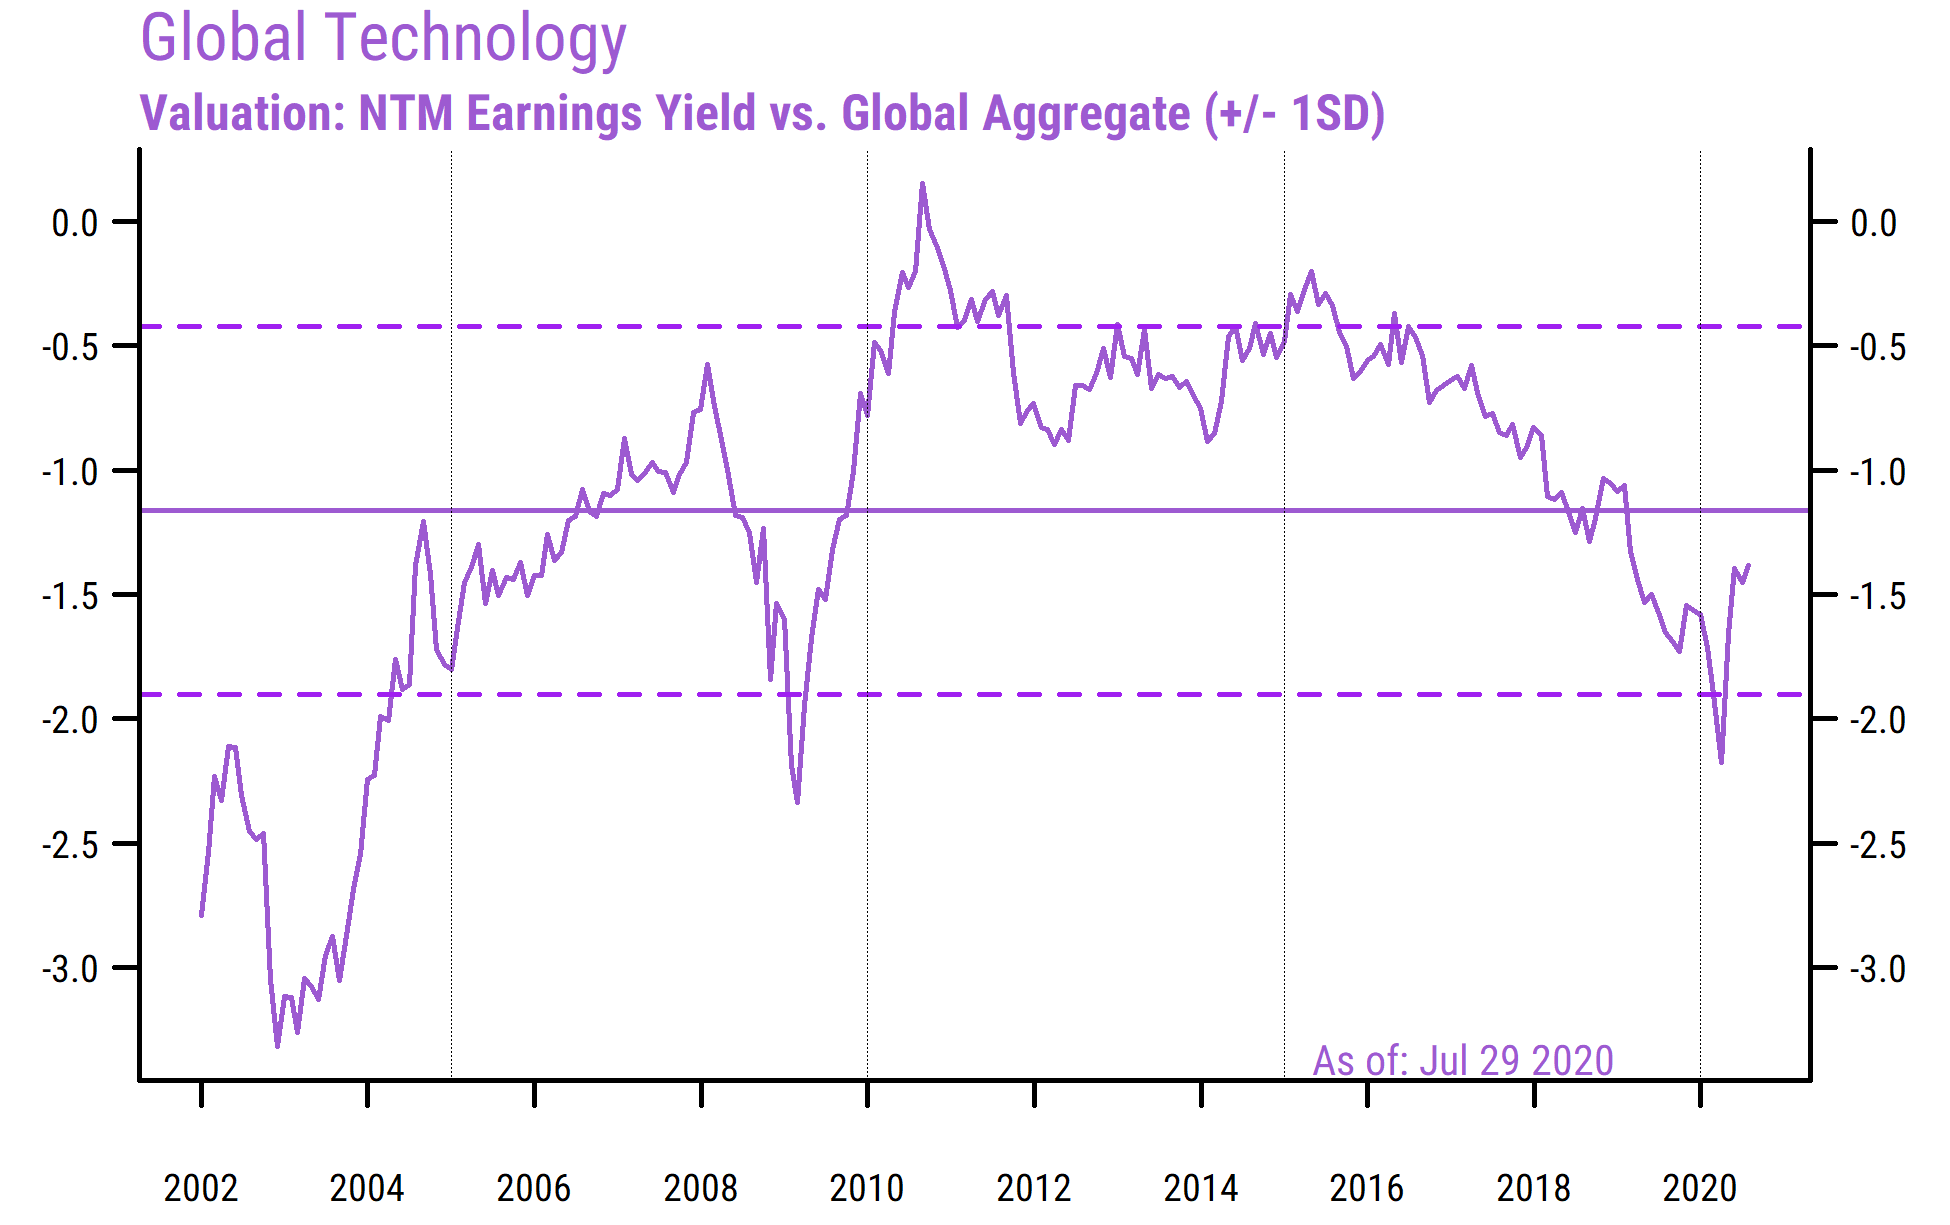
- Based on the relative forward earnings yields1 in Technology versus the global average, the typical Tech stock is not currently very far out of line with historical norms on a relative basis in our work. And Tech stocks are actually cheaper on a relative basis now than they were at the start of the year.
- The chart above shows the relative forward earnings yield for the median2 stock in the global Tech sector relative to the median stock in the global universe. The solid horizontal line is the long-run average, and the dashed lines are +/- 1 standard deviation from the average.
- The current reading of -1.4% reflects the Tech sector’s current median forward earnings yield of 3.5% (equal to a forward P/E of 28.5) being 1.4% lower than the global median forward earnings yield of 4.9% (equal to a forward P/E of 20.4).
- Technology is a growth sector, so it almost always trades at a lower forward earnings yield (higher P/E) than the overall market. Historically, the earnings yield differential has averaged about -1.2%, so the current valuation spread (-1.4%) is actually quite close to the long-run average.
- Even though Technology has outperformed this year, the sector’s relative valuation has actually improved since the start of the year (from -1.6% to -1.4%). This is because expected earnings for Technology have also outperformed the global average by a substantial margin this year.
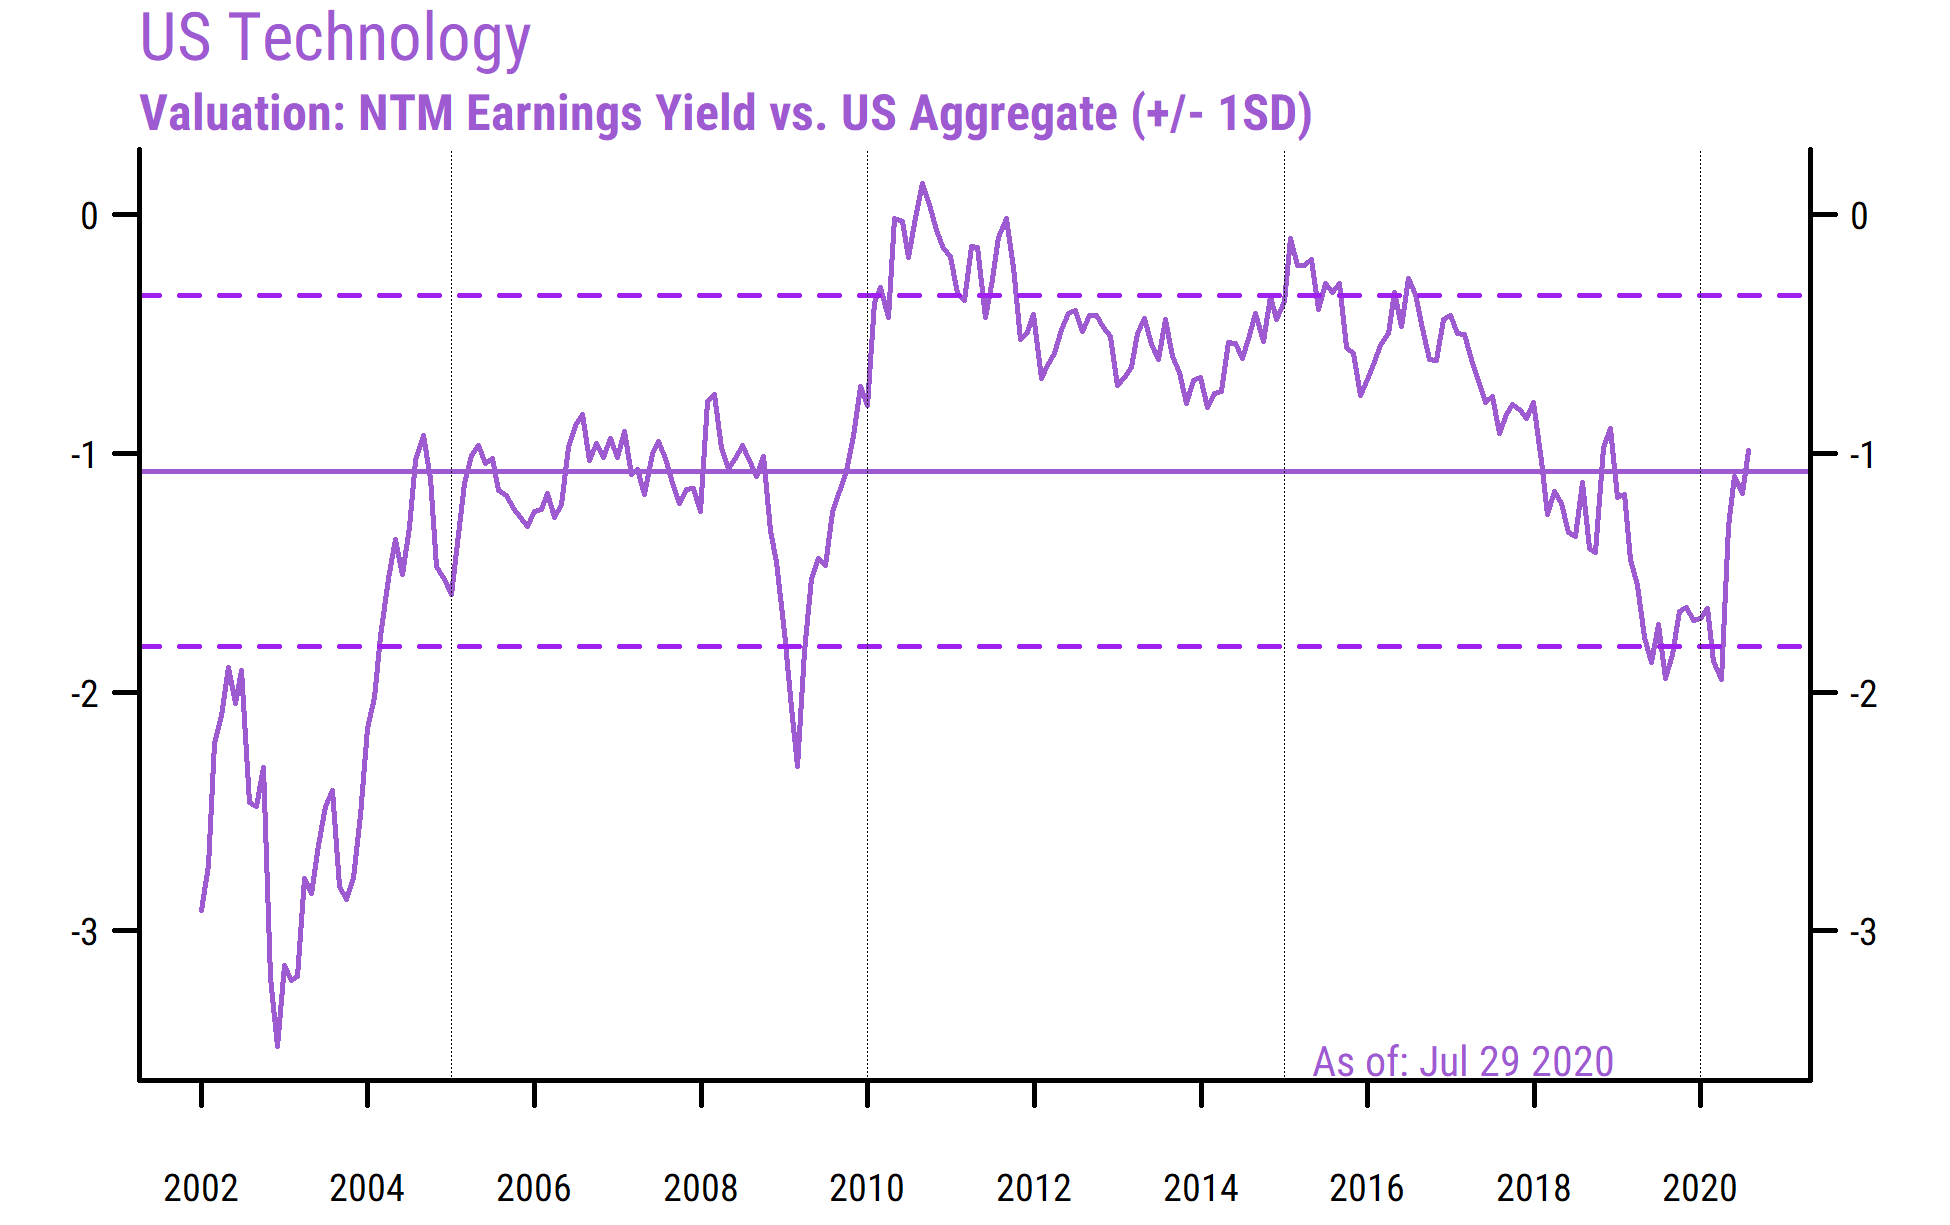
- Confirming the global figures, the chart below shows the same calculation for the US Technology sector, where it may come as a surprise to some to see that the median US Technology stock is actually slightly cheaper than average on a relative basis now, and significantly cheaper than at the start of this year.
Using valuation alone as a timing tool can be quite challenging, but our data suggest that Tech stocks are not especially overvalued on a relative basis (i.e., putting aside whether the entire equity market is fairly valued or not on an absolute basis). So long as earnings in Technology continue to outpace the average, valuation does not appear to be a major headwind to the sector’s relative performance at this point, either globally or in the US.
1 We use earnings yields (earnings/price ratios) instead of price/earnings ratios in aggregate calculations to properly account for the presence of companies with negative earnings. Consequently, higher numbers are more favorable. The forward earnings are based on rolling 12-month forward consensus estimates.
2 Using the median stock avoids potential distortions that can occur in cap-weighted calculations, where unusual movements in a few mega-cap components can skew the sector’s valuation figures at times.