12 July 2022
Markets remain volatile, but the narrative driving the volatility has been shifting recently, a topic we have written about and discussed with clients recently. For much of the year, the concern was that the economy was “too strong” and inflation was out of control, and thus the Fed would need to raise rates and reduce their balance sheet quite aggressively to combat inflation. The Fed has taken several steps in that direction, but now conditions have changed such that investors are more worried about growth slowing too quickly and turning into a recession rather than excessive inflation.
So the questions have grown: does the Fed really need to raise rates much further than it already has? Or has the combination of fiscal and monetary tightening implemented thus far had the desired effect already, and further tightening would risk going beyond “slowing” the rate of economic growth to “stopping” it altogether?
Policy rates: Up, then down?
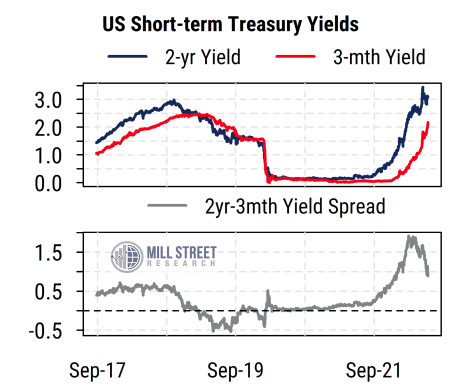
Markets have already reduced their longer-term expectations for future Fed rate hikes, and are pricing in eventual rate cuts starting later next year. In the near-term, however, all indications are that the Fed will raise rates significantly (i.e., at least 50bps) at their meeting on July 27th, and perhaps again at the Sept. 21st meeting.
The difference between the two-year and three-month Treasury bill yields (chart below) is a measure of expected future policy rate changes. After reaching a peak spread of nearly 200 basis points, the differential has dropped back to only about 100 bps. Three-month T-bill yields peaked at about 2.5% in early 2019, and the two-year yield is only moderately higher than that level now.
 Source: Mill Street Research, Factset
The Fed is clearly under public and political pressure to bring inflation down quickly, despite the well-known limitations of their true power to control inflation directly. Interest rates and balance sheet operations are very blunt tools, which primarily impact demand in certain interest-sensitive areas of the economy, but have little to do with supply constraints. And in our view, fiscal policy is more important for overall economic growth and inflation pressure than monetary policy nowadays, particularly since the banking system (the Fed’s real focus of oversight) is broadly in good shape in the US.
There is a growing list of indicators that suggest that there is no longer “excess demand” pressure in the US economy, and inflation pressures and expectations are already in the process of receding. We briefly review them below.
Growth has clearly slowed sharply, no longer “too hot”
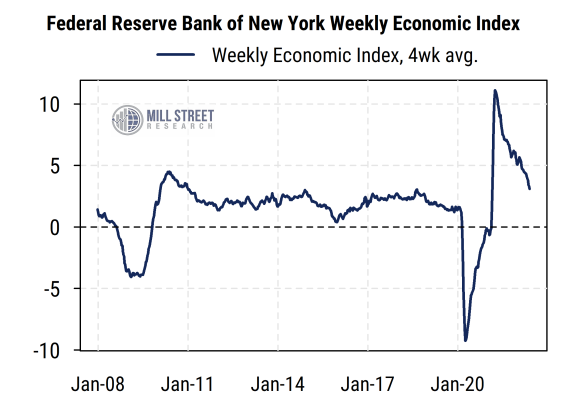
The Federal Reserve Bank of New York publishes a Weekly Economic Index, which uses higher-frequency economic data to estimate the current rate of economic growth, expressed in terms of year-on-year real GDP growth rate. The index includes things like unemployment claims, retail sales, tax withholding, steel production, railroad traffic, electricity output, etc.
The chart below plots the four-week average of the weekly readings, with the latest falling to 3%. This is now within the pre-COVID range of readings and likely to continue to ease.
This data strongly suggests that economic activity is no longer “excessive” and that demand has already weakened significantly.
 Source: Mill Street Research, Factset
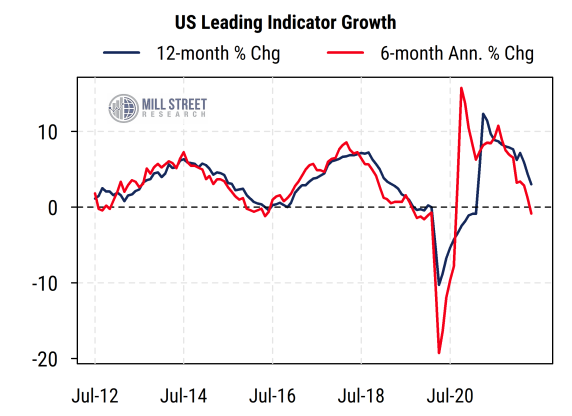
Confirming the Weekly Economic Index, the chart below shows the growth rate of the US Leading Economic Indicators (LEIs), a composite of 10 indicators that tend to lead economic growth (one of which is the stock market). The six-month annualized change in the LEIs has already turned slightly negative, while the 12-month change has slowed rapidly and, at 3%, is far from excessive levels. The economy has clearly already slowed significantly, and could continue to slow near-term based on the LEIs.
 Source: Mill Street Research, Factset
Fiscal policy has already tightened sharply
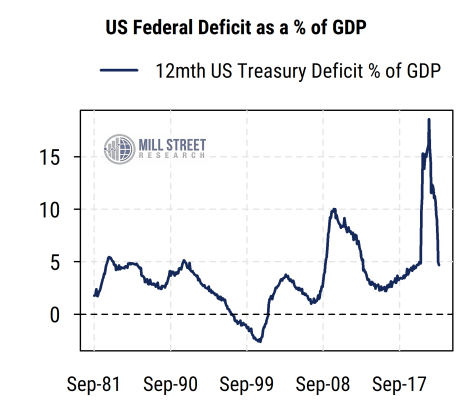
A crude measure of US fiscal policy is the federal deficit/GDP ratio, measuring the rolling 12-month US federal budget deficit as a percentage of nominal GDP. After surging to a brief peak of about 18% in the immediate aftermath of COVID when GDP was depressed and fiscal stimulus was at its maximum, it has reversed dramatically back to levels below 5% seen just before COVID hit (chart below). As almost all of the COVID-related stimulus programs are finished and tax receipts have risen, the deficit has fallen sharply, while GDP has risen to new highs.
 Source: Mill Street Research, Factset
Housing market in particular is slowing
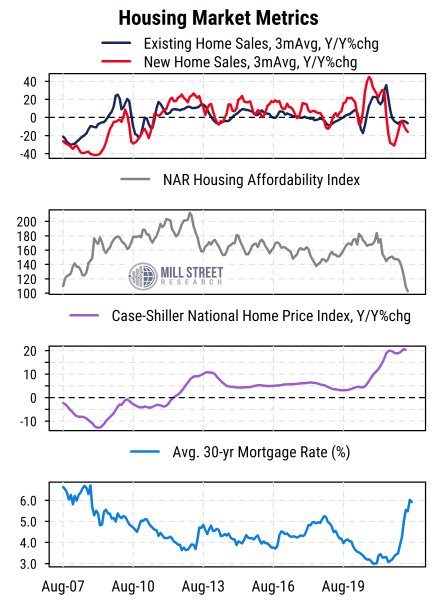
The housing market is arguably one of the areas most sensitive to Fed policy, and it has also shown clear signs of slowing activity (if not prices yet).
Affordability for US homebuyers (mortgage payments relative to income) is now at its worst readings since 2007. This is driven by a combination of surging mortgage rates and sharply higher home prices.
So while the banking system is in a far better position than it was in 2007, housing demand is already slowing down, as reflected by new and existing home sales, as well as mortgage application activity. Home prices will likely follow along soon, and there are some early signs of this already happening (including weakness in the earnings estimates and stock prices of homebuilders).
 Source: Mill Street Research, Factset, Bloomberg
The surge in mortgage rates to 15-year highs means that the markets have already done much of the Fed’s work for it, and it is likely not necessary to force rates even higher still to control inflation in housing.
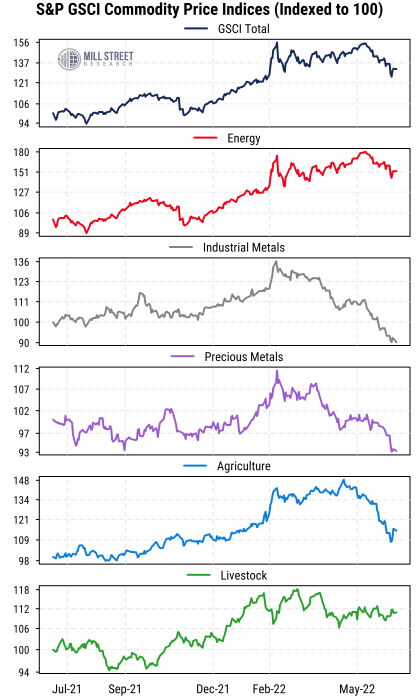
Commodity prices have fallen recently, especially industrial metals
Perhaps the most direct, real-time measure of prices and inflation pressure comes from the commodity markets. Many commodities outside of energy began rolling over in the last few months, especially the economically sensitive industrial metals (copper, nickel, aluminum, etc.). More recently, food prices have turned sharply lower, and just in the last couple of weeks we have seen a sharp pullback in energy prices. This was led by US natural gas prices, and now oil and gasoline have also pulled back. In addition, the longer-term futures prices in crude oil continue to point to much lower prices in the next 2-3 years, i.e, ~$70/bbl. expected in 2025 vs. $100 currently and a recent peak of $120.
 Source: Mill Street Research, Factset
This broad-based pullback in commodity prices, even those connected to Russia’s invasion of Ukraine (oil, wheat, etc.) is another indication that demand has weakened in the face of higher prices and tighter policy. These commodity price declines will take a bit of time to show up in consumer prices, but clearly the upward pressure coming from commodities earlier in the year has faded away.
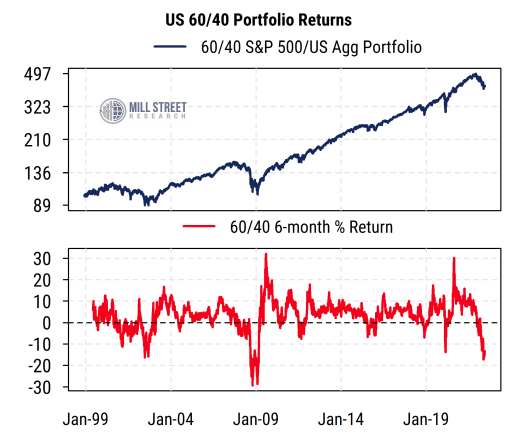
Stock and bond prices have fallen, especially the riskiest, creating a negative wealth effect
This year has been quite unusual in that both stock and bond returns have been decisively negative at the same time. Indeed, by some measures stocks have outperformed bonds by declining less this year. There has also been a shift toward Value and lower-risk stocks within the equity market and a corresponding shift toward higher quality bonds. The riskiest parts of the equity and debt markets have been hit hardest, as is often the case when monetary conditions tighten following a period of low rates and high risk appetite.
The coincident weakness in both stocks and bonds has meant that the traditional “60/40” portfolio of 60% equities (S&P 500) and 40% bonds (Bloomberg US Aggregate Bond Index) has had its worst six-month return since 2008 (chart below), following a period of strong positive returns after mid-2020.
 Source: Mill Street Research, Factset, Bloomberg
The aggregate impact recently has been to reverse the “wealth effect” that likely gave people more money to spend last year. While not the Fed’s primary goal, seeing reduced speculative enthusiasm and a negative wealth effect that can reduce overall consumer demand also suggests that much of their potential work has likely been done already.
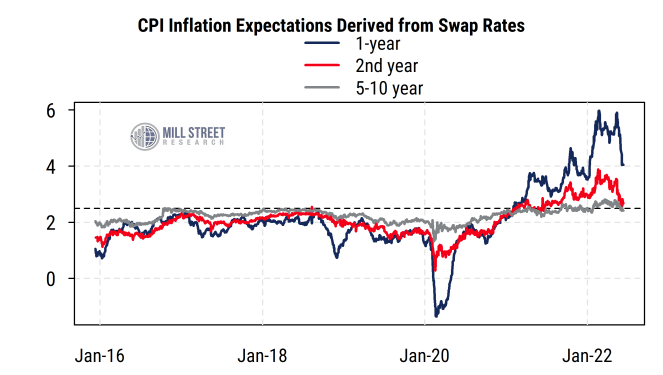
Inflation expectations have fallen, longer-term now at Fed target
Perhaps most importantly, key measures of market expectations of future inflation have fallen sharply recently. Indeed, current market prices imply expectations that inflation will return to near the Fed’s 2.5% CPI target (or 2.0% PCE) within the next year or two, and will remain there longer-term (chart below).
 Source: Mill Street Research, Factset, Bloomberg
This represents a significant decline in expectations in just the last month, as investors see the impact that policy tightening thus far has already had on demand and affordability. While surveys of consumer inflation expectations (which tend to be anchored more to salient prices like gasoline) may take a bit more time to reverse, worries about “unanchored” expectations have likely receded.
The Fed can see these conditions, but will it change its tune?
As noted earlier, the Fed is likely aware of this information, but also faces heavy pressure from those claiming it is “behind the curve” and now must tighten more aggressively to “catch up”, particularly given the extreme inflation readings seen over the past year. While we can hope that the Fed does not in fact end up overtightening and causing an unnecessarily steep recession, it remains a possibility. Some of this risk (a sharp slowdown or even mild recession) is likely priced into equities and other risk assets now, but excessive tightening could provoke further economic and market weakness.