While the Technology sector has been less dominant in terms of returns this year than it was last year, it remains the largest sector in the US market by value and the focus of much investor attention.
Our view within the Technology sector for some time now has been to favor hardware-related industries over software-related or services areas, and the latest update of both bottom-up and top-down indicators continues to support this view.
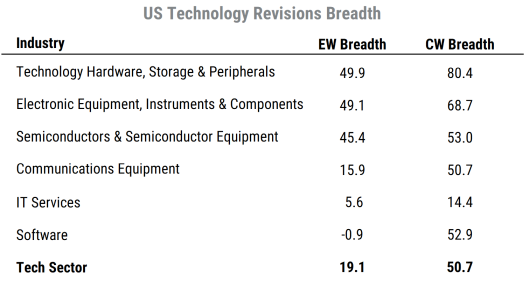
The table below shows some of the key bottom-up fundamental metrics we track for all sectors and industries, and focuses on the six US Technology sector industries (using the GICS industry classifications) within our broad 2300-stock US universe.
The revisions breadth measures shown in the table are based on the proportion of analysts covering each stock who have raised their earnings estimates over the last three months net of those who have lowered earnings estimates. That is, the number of upward revisions to estimates minus the number of downward revisions relative to the total number of analysts covering a stock. We use a weighted average of estimates for each company’s current fiscal year (2021 for most companies right now) and next year (2022) to calculate a consistent 12-month forward earnings figure.
 Source: Mill Street Research, Factset
The first column shows the average breadth reading for all stocks in each industry on an equal-weighted (“EW”) basis, while the second column shows the same data on a cap-weighted (“CW”) basis. Naturally, the cap-weighted figures give much more weight to the largest stocks in each industry, while the equal-weighted figures will be relatively more tilted toward smaller names. All stocks in our US universe require a minimum market capitalization of $200 million and at least three analysts reporting estimates, among other criteria, so there are no micro-caps or stocks with very few analysts included.
A few key points jump out from the table:
- Revisions remain net positive in most areas of Technology, in line with the broadly positive revisions activity in US stocks overall.
- The average revisions breadth readings on a cap-weighted basis are higher in every industry than the equal-weighted readings, and often much higher. The sector-wide average of about 51% far exceeds the equal-weighted average of about 19%. This means the largest Tech stocks have much more positive analyst activity than the average stock in the sector, i.e., a big-cap bias.
- The strongest industries are those which focus on hardware right now, while software and services industries are substantially weaker.
We see that on an equal-weighted basis, the Technology Hardware, Storage & Peripherals industry has the highest proportion of positive revisions, followed closely by Electronic Equipment, Instruments & Components and then Semiconductors & Semiconductor Equipment. All three of these hardware-related industries also have the highest revisions breadth on a cap-weighted basis.
At the bottom of the list we see the large Software industry, which has marginally negative net revisions breadth on an equal-weighted basis. This means the average Software stock has a roughly equal number of analysts raising versus lowering estimates. However, on a cap-weighted basis, the revisions figure is strongly positive. This means that a few mega-cap names in the industry have strong revisions, while the majority of mid- and smaller-cap names have relatively weak revisions.
A similar but less dramatic picture is seen in IT Services, where revisions are much lower than in the hardware related industries on both equal-weighted and cap-weighted metrics. The cap-weighted figure is still higher than the equal-weighted, as it is for all Tech industries, but by a much smaller margin than in Software.
The overall picture from the bottom-up, stock level analyst revisions data is that hardware makers continue to surprise analysts positively across large and smaller companies alike, while providers of software and tech-related services are much more mixed and dominated by the largest names in those areas.
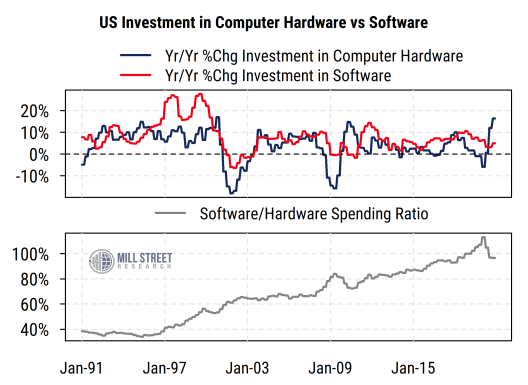
The second chart below provides some macro, top-down context for the bottom-up fundamentals we see. The top section of the chart plots the year-on-year percent changes in aggregate spending on investment in computer hardware (blue line) and in software (red line) over the last 30 years. The data come from the quarterly GDP data produced by the US Bureau of Economic Analysis. As of the end of 2020, the growth rate of investment in computer hardware had jumped to 16%, the highest reading since the previous recessionary rebound in 2009-10. Growth in software investment spending, by contrast, had only grown 5%, which is near the lower end of its recent historical range.
 Source: Mill Street Research, Bureau of Economic Analysis
The bottom section of the chart plots the ratio of software to hardware spending over time. We see that the line has tended to rise, indicating higher growth in software spending than hardware spending on average over the long run. But the latest readings show a drop, reflecting the jump back toward hardware spending that occurred last year and likely is still ongoing. In the longer-term, it seems likely that software spending will again resume its higher growth rate versus hardware, but the preference for hardware is still very visible in current analyst earnings forecast behavior and could last a while longer as the world continues to adapt to the post-COVID landscape.