14 December 2021
There have been a number of headlines recently highlighting the extraordinary market capitalization being awarded to Apple Inc. (AAPL), which has retaken the title as the world’s most valuable publicly-traded company.
The company’s value is now approaching $3 trillion, a level that places it not only as the largest individual company ever on public markets, but would rank it among the largest stock markets.
At a client’s request, we extracted aggregated month-end data from our broad 6500-stock global database to estimate the total value of three widely watched fundamental metrics for the 19 largest countries plus Apple. Those metrics are:
- equity market capitalization,
- current year estimated earnings (operating income), and
- current year estimated sales (revenues)
All figures are converted to US dollar terms. The earnings and sales estimates are based on company-level consensus estimates for those figures for the current fiscal year, as reported by Factset. The equity market values reflect all shares outstanding for each company, not just those considered “float” or freely tradeable as is done in some equity indices. Due to differences in calculations and universe constituents, these data may not match the figures published by index providers but should be broadly representative.
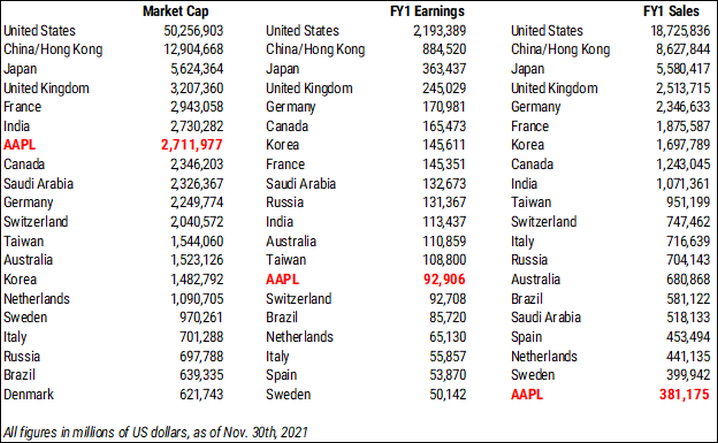
The table below shows the results, with Apple (shown with its ticker symbol) highlighted in each column in red.
 Source: Mill Street Research, Factset
As of the end of November, Apple’s market value of $2.7 trillion would rank it as the seventh largest country by market cap, just behind India and France, and ahead of Canada, Saudi Arabia, and Germany.
Apple’s valuation based on earnings and sales is higher than that of most countries, so when viewed on the basis of total earnings or sales, it ranks somewhat lower. On current year estimated operating earnings of about $93 billion, it would rank 14th, between the total earnings of all Taiwan-listed stocks and all stocks listed in Switzerland.
Apple’s high valuation (about seven times estimated sales) is in part based on its above-average profit margins (~24%), which helps explain why its rank based on total sales is lower than it is by earnings or market cap. Apple is expected to produce total revenues of about $381 billion during its current fiscal year, which is slightly less than all of the 105 stocks we track listed in Sweden are expected to produce together, and would rank it about 20th among countries.
Notably, even though Apple has such a large market valuation relative to that of other countries, its size relative to the giant overall US stock market is not extreme when compared to the largest stocks in other countries. For example, while Apple is roughly 5% of the total US market value, in France the luxury goods maker LVMH Moet Hennessy Louis Vuitton makes up about 13% of the French stock market in our data, and Nestle makes up about 18% of the Swiss stock market. However, it would be hard to exceed the single-stock dominance of the Saudi stock market, where the $1.8 trillion notional market value of Saudi Aramco makes up nearly 80% of the country’s market value (though only about 2% of the Saudi Aramco shares “float”, or are available for trading).
We have highlighted Apple because it is currently the largest and is making headlines, but of course it is not alone as Microsoft is close behind it with a market value of $2.5 trillion at the end of November. And three other US companies have market values above $1 trillion now: Amazon.com, Alphabet, and Tesla.
These figures hopefully give some perspective on the size of companies and countries, but alone they do not argue for or against an investment in any of the stocks or countries identified here. These are not recommendations to buy or sell any security and investors should do further research before trading.