There has been much discussion about the increasing concentration of the market cap weighted indices in the US, with the S&P 500 now showing some of the highest levels of concentration among the largest constituents in history. The top 20 S&P 500 stocks (4% of the constituents) currently comprise 38.6% of the index weight, while the top five companies alone make up 23.8% of the weight.
But what about the underlying fundamentals? Are they as concentrated as the capitalization weightings? Broadly speaking, the answer is yes.
Following are a chart and two tables based on the top 20 stocks in the S&P 500. The chart below shows the proportion of total estimated operating income and sales made up by the top 20 S&P 500 stocks each month over the last 15 years. The figures are based on consensus analyst forecasts for net income and sales for the current fiscal year (currently FY2020), rather than trailing reported financials.
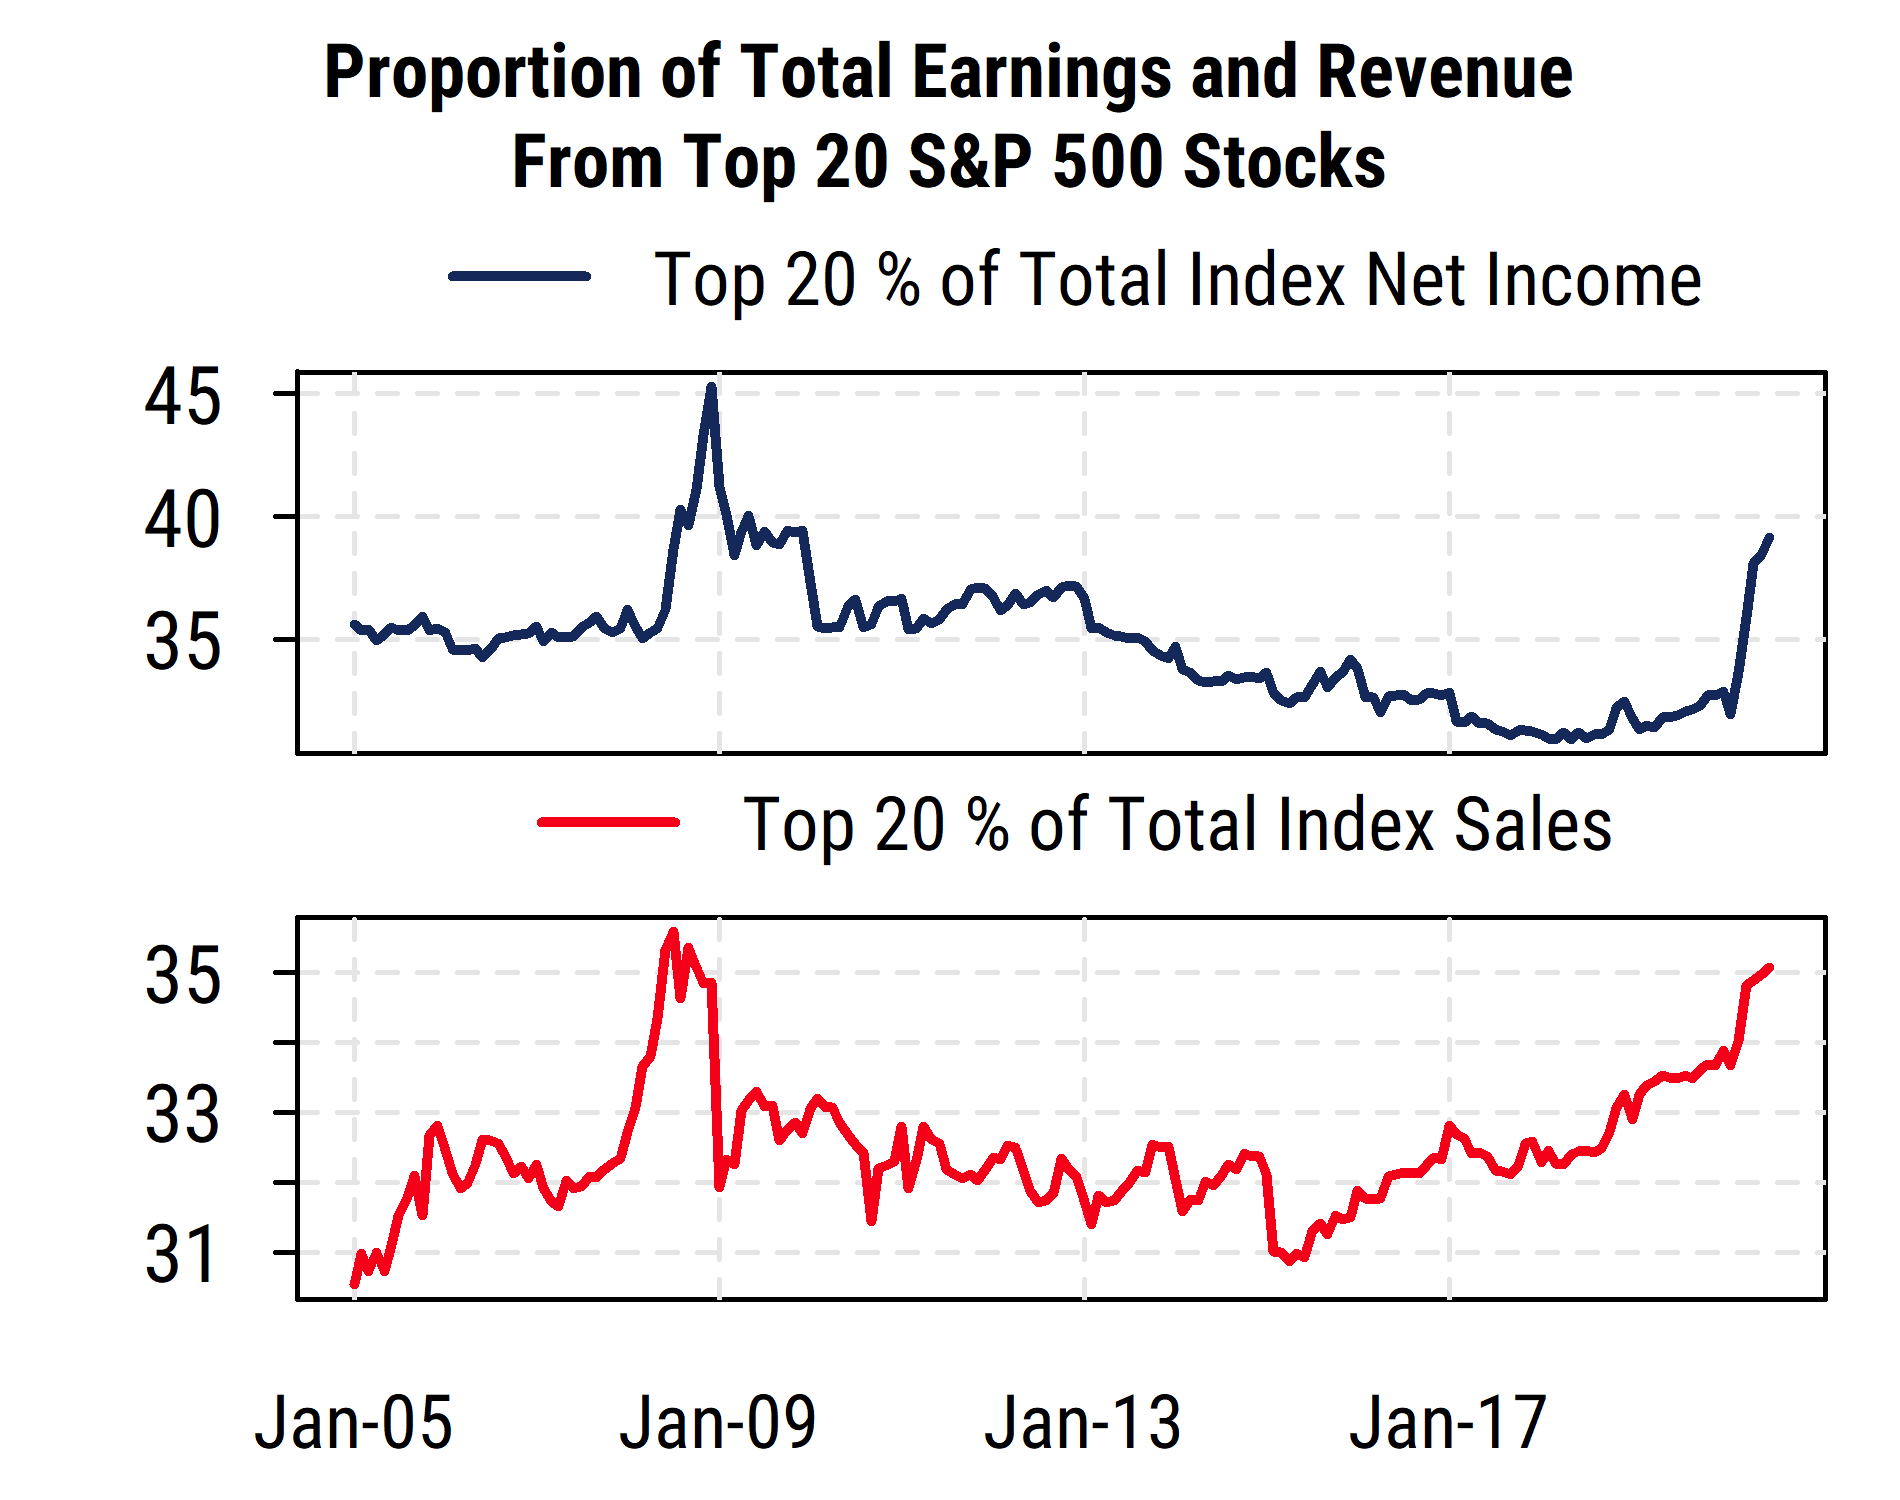
The first message from the chart is that the top 20 stocks do in fact make up an increasing proportion of income and sales, but the proportion is not historically outlandish. The largest stocks have tended to produce 30-40% of total index earnings and 31-35% of total sales, and are near the upper end of those ranges now.
And possibly more surprising to some, the proportion of earnings expected to be generated this year by the top 20 stocks is very similar to the proportion of market cap they hold (39.1% of earnings as of the end of July, vs 38.5% of market cap). The proportion of sales from the top 20 is similar but slightly lower at 35%. So the most heavily weighted stocks in the index are in fact producing a comparable proportion of earnings and sales in aggregate (not for every stock of course). The S&P 500 has long been “top-heavy” to varying degrees due to the presence of a few dominant mega-cap stocks, but right now that broadly captures the similarly concentrated nature of the underlying fundamentals.
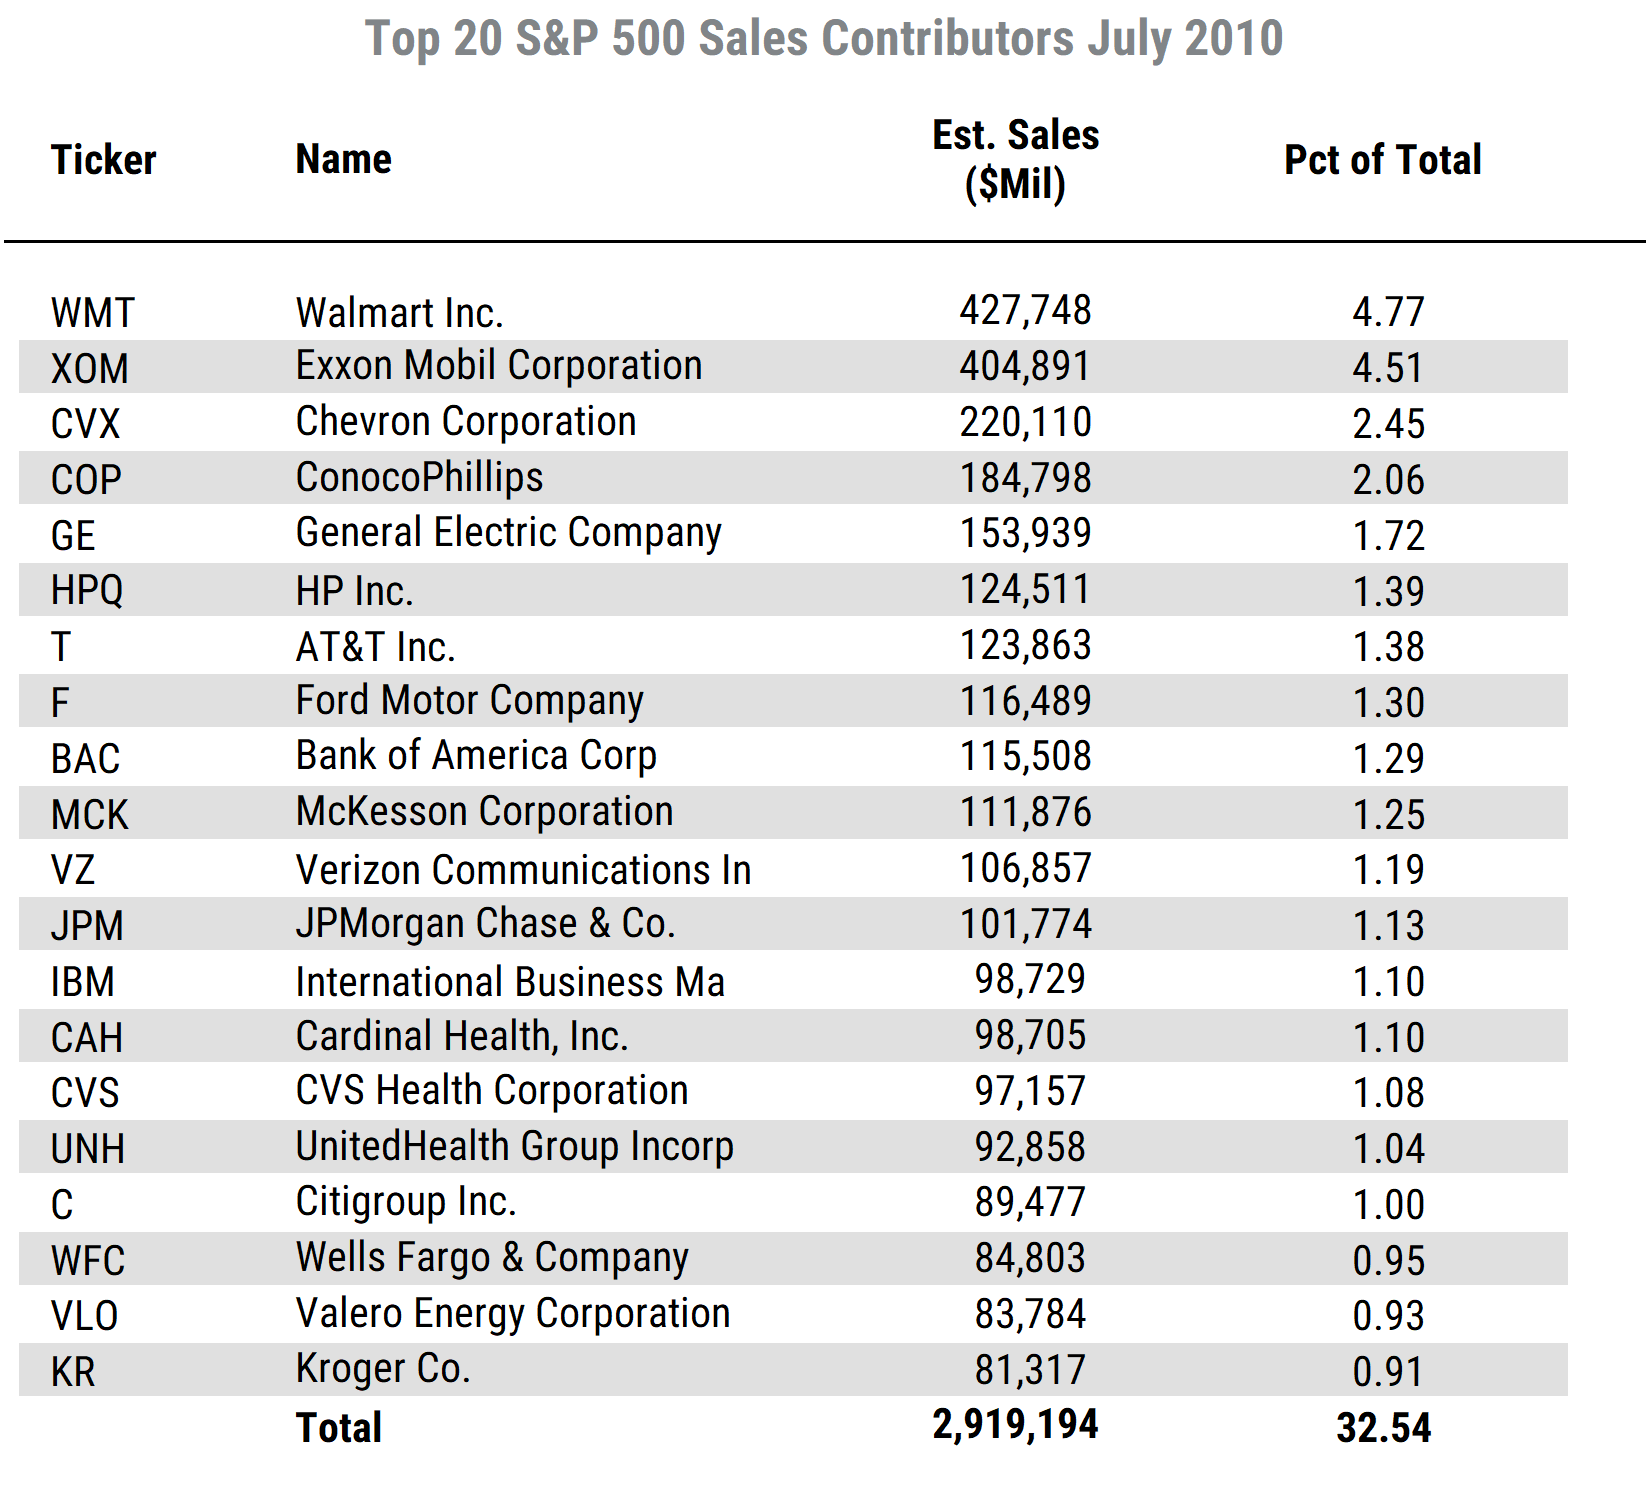
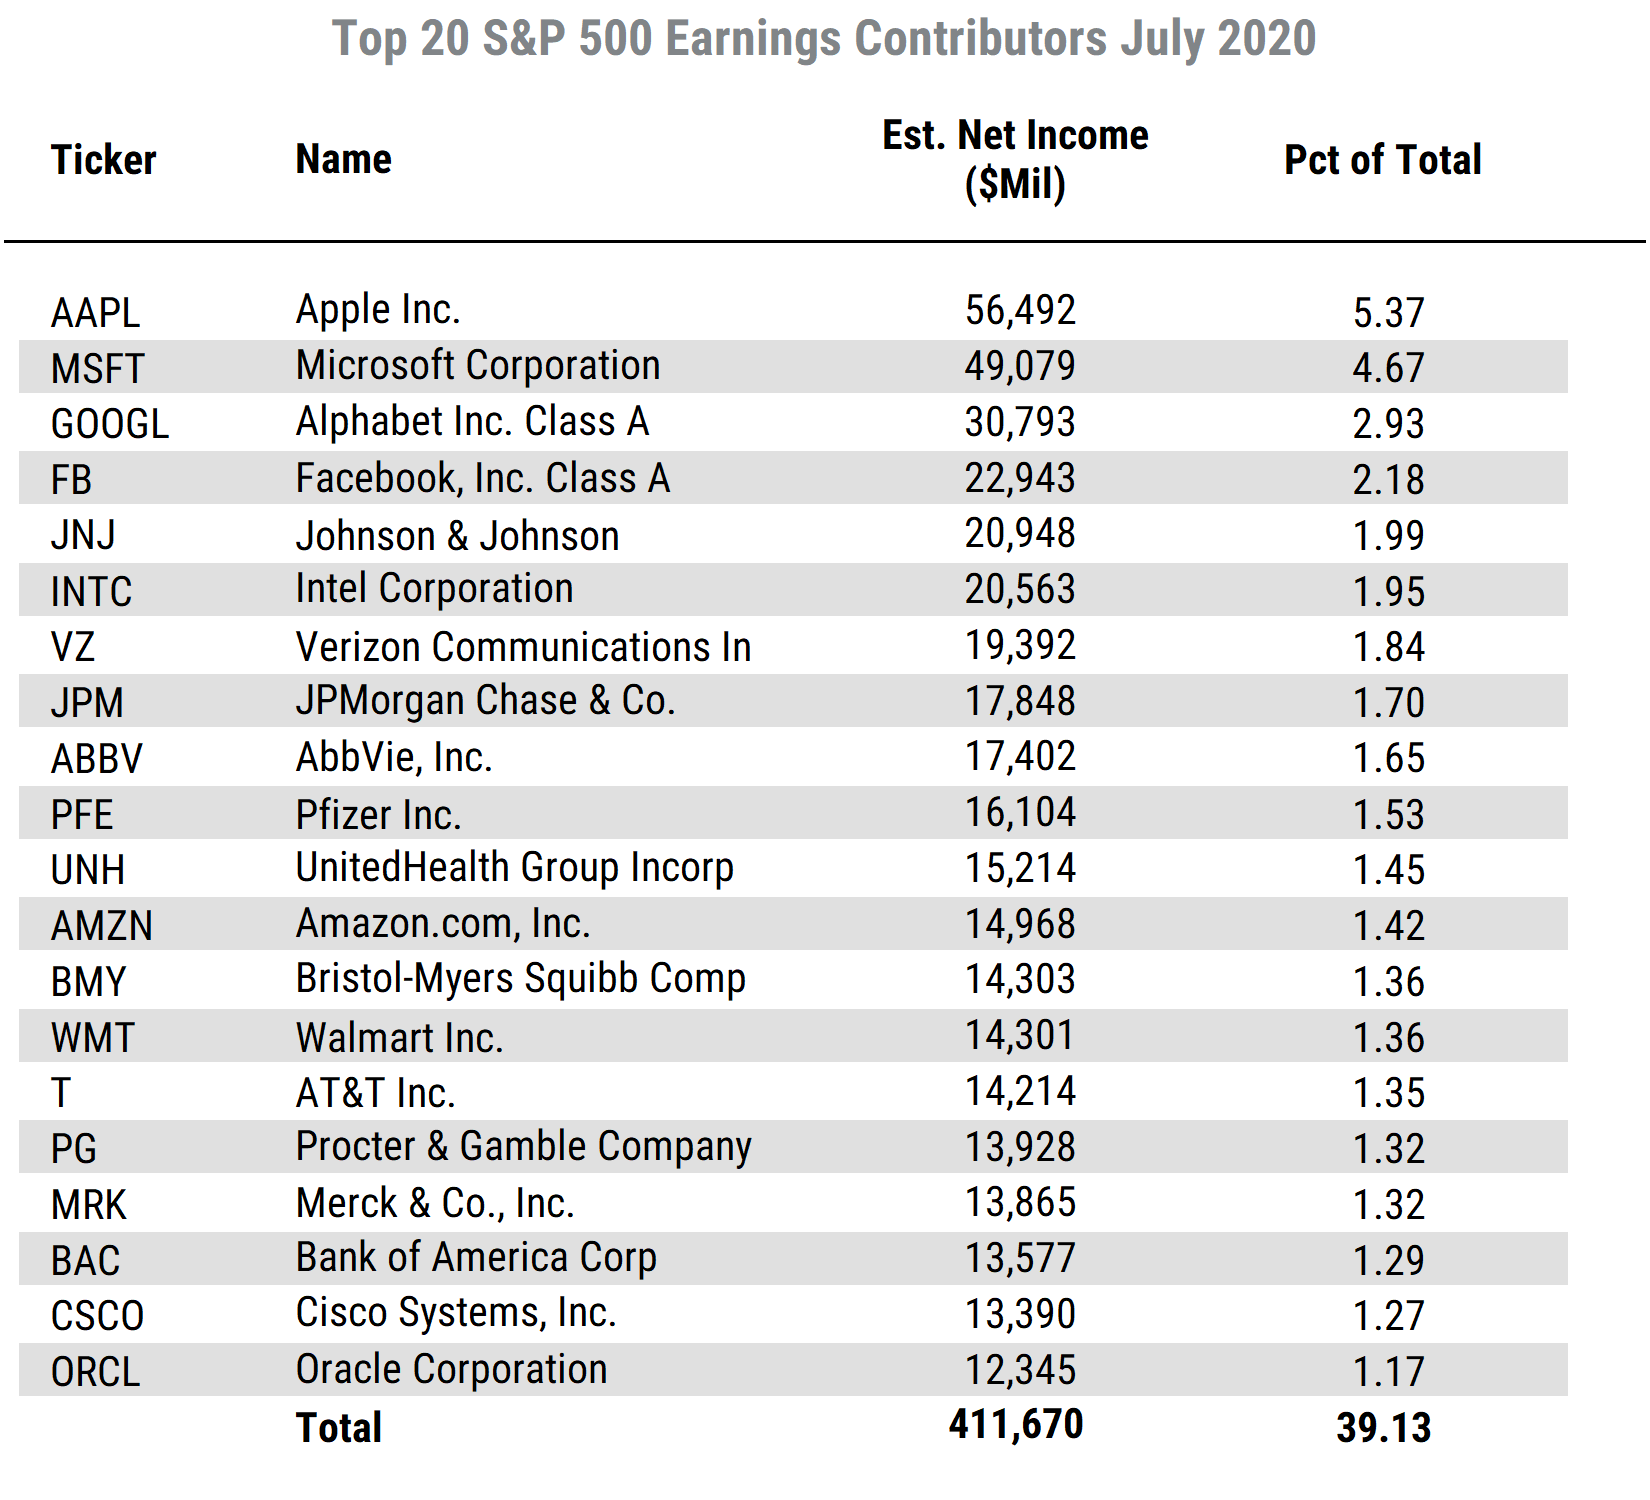
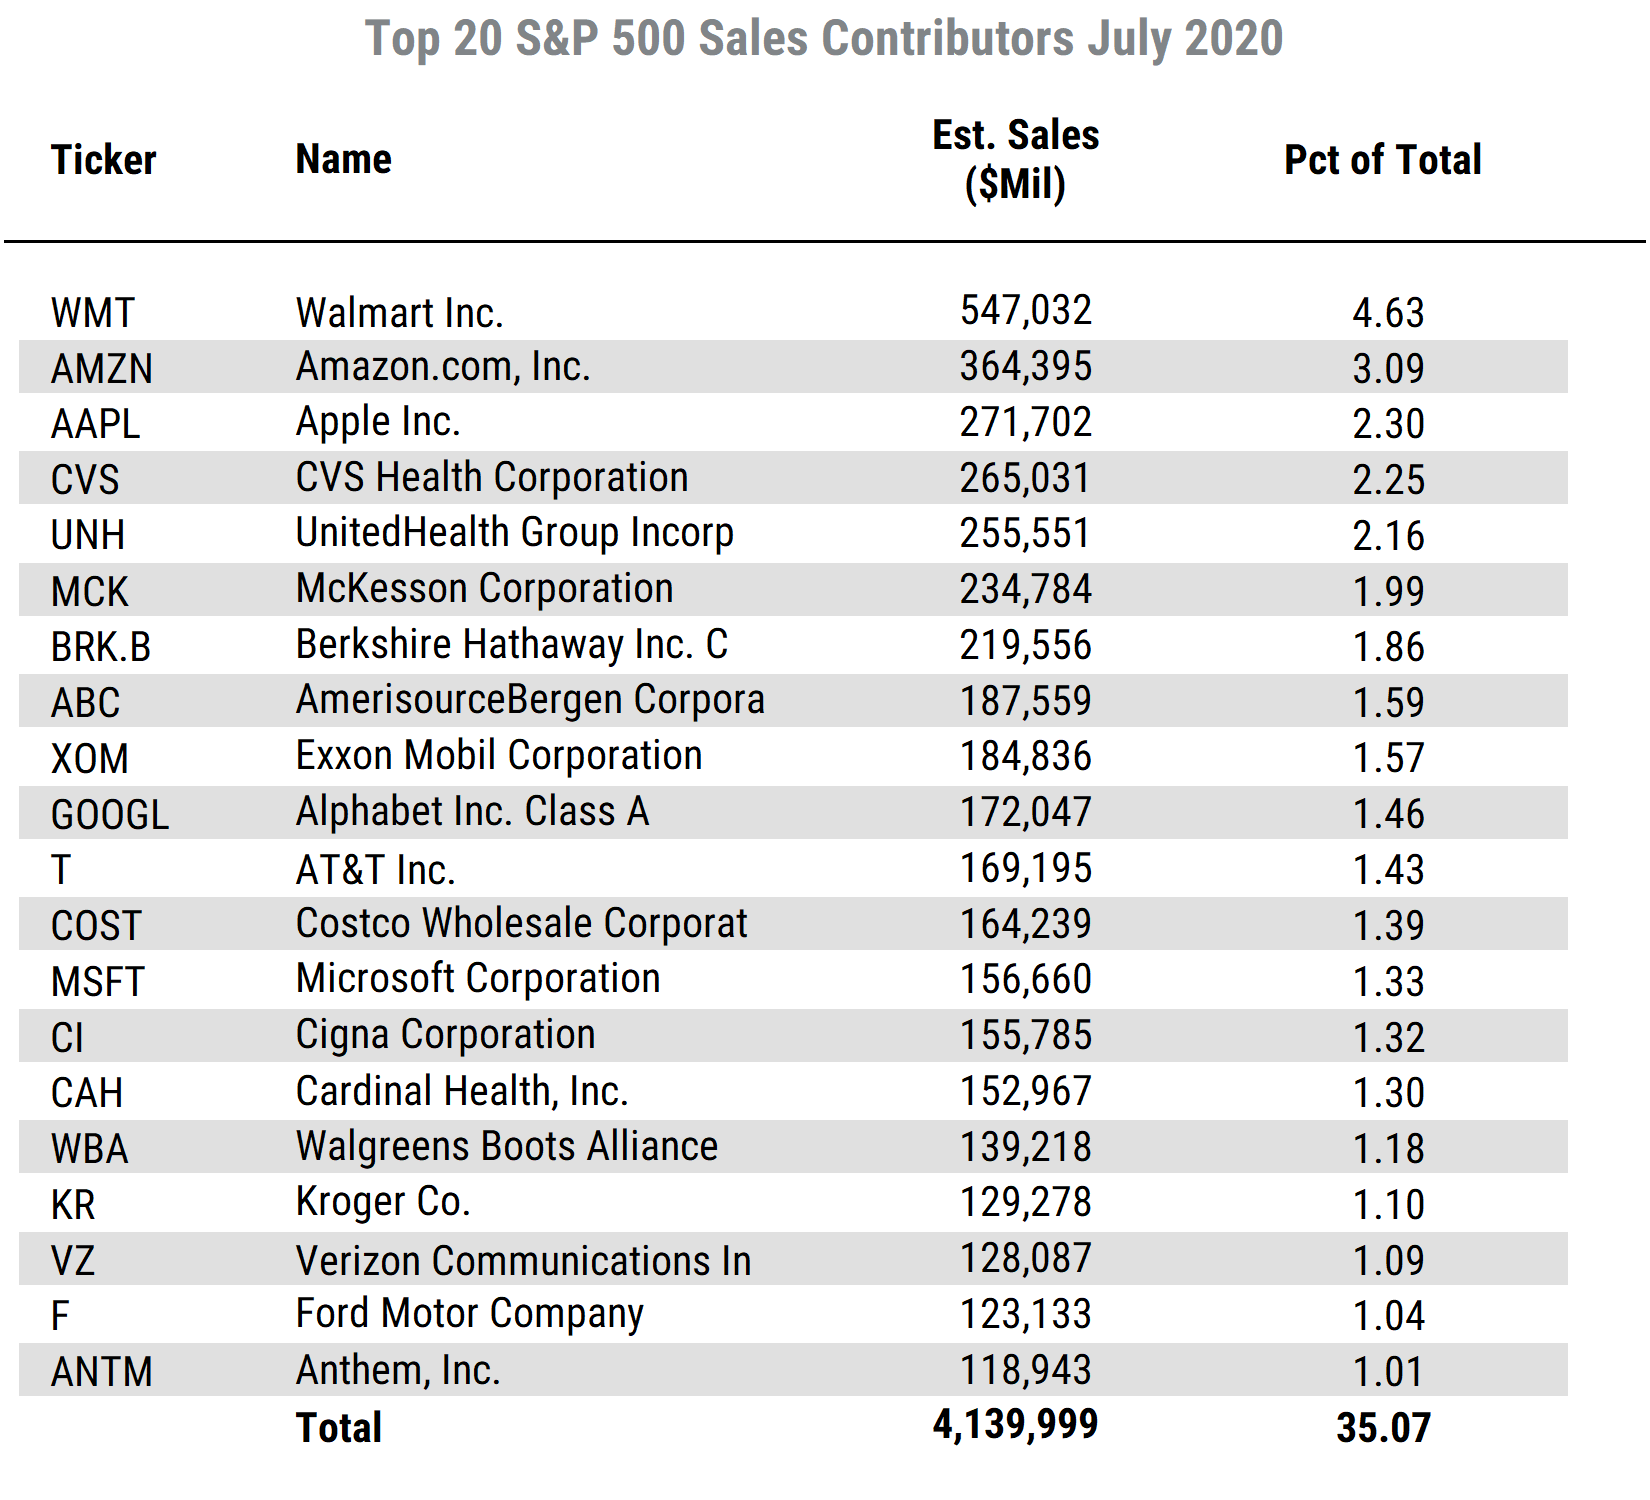
What are the top 20 stocks by earnings and sales? The tables below show the latest monthly lists. While some names naturally appear on both lists, there are some notable differences in the lists of earnings versus sales, as profitability varies significantly in some cases. Amazon.com, for instance, has the second largest sales but is not among the top 20 for earnings. The same is true for a number of other well-known names whose earnings are either depressed right now or whose profitability is structurally lower.
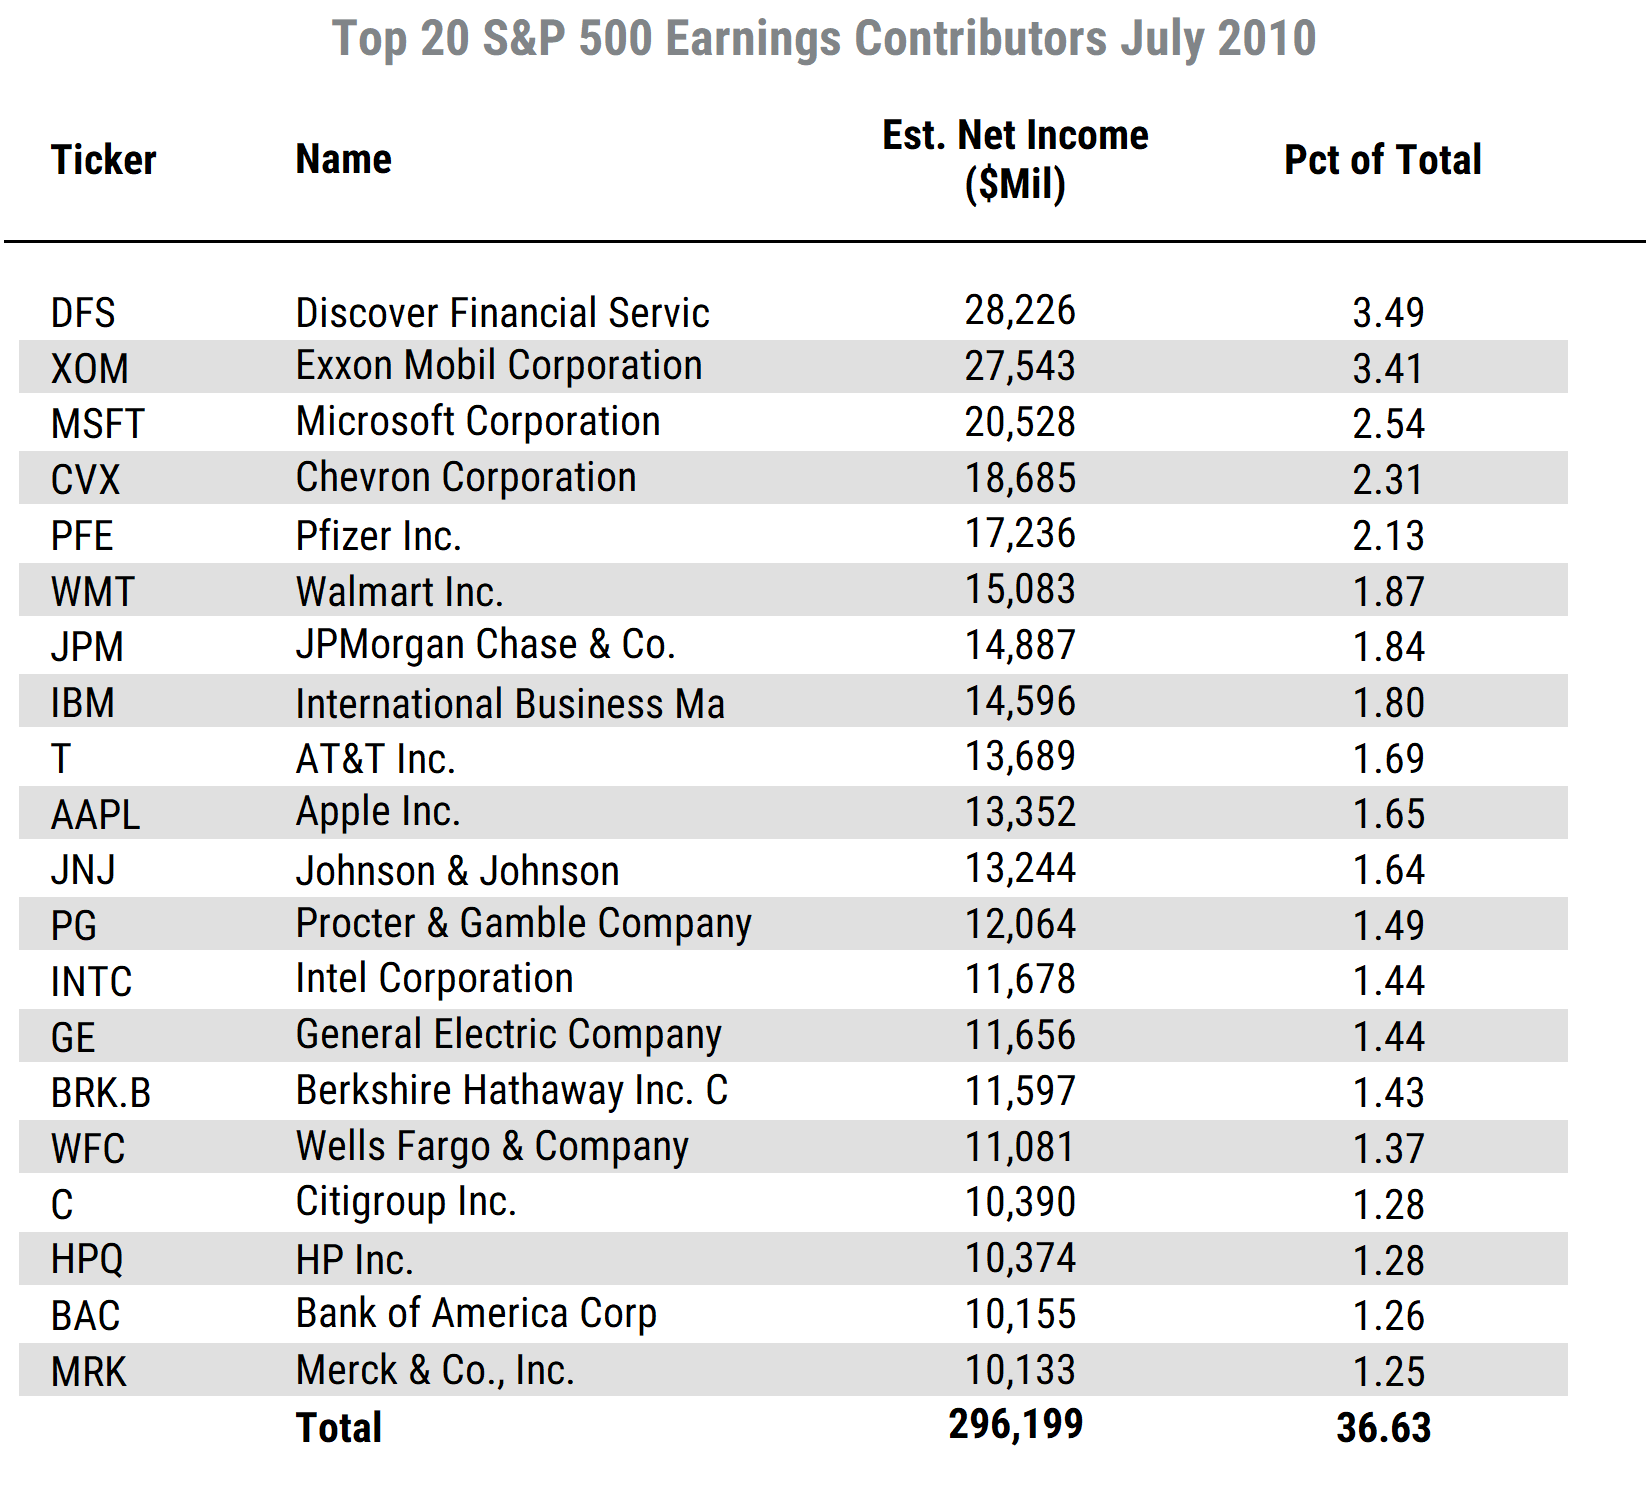
And finally, for some interesting historical perspective, the tables below show the top 20 S&P 500 stocks by earnings and sales 10 years ago (as of July 2010). Notably, the range of estimated profits among the top 20 was narrower 10 years ago, and a number of the names have changed over the last decade.