The US has had stronger earnings growth than much of the rest of the world, but it has been unable to outperform this year due to the narrowing of its valuation premium. This likely reflects a combination of stronger ex-US earnings growth, high US policy risk, and the rapidly growing relative concentration risk in the S&P 500.
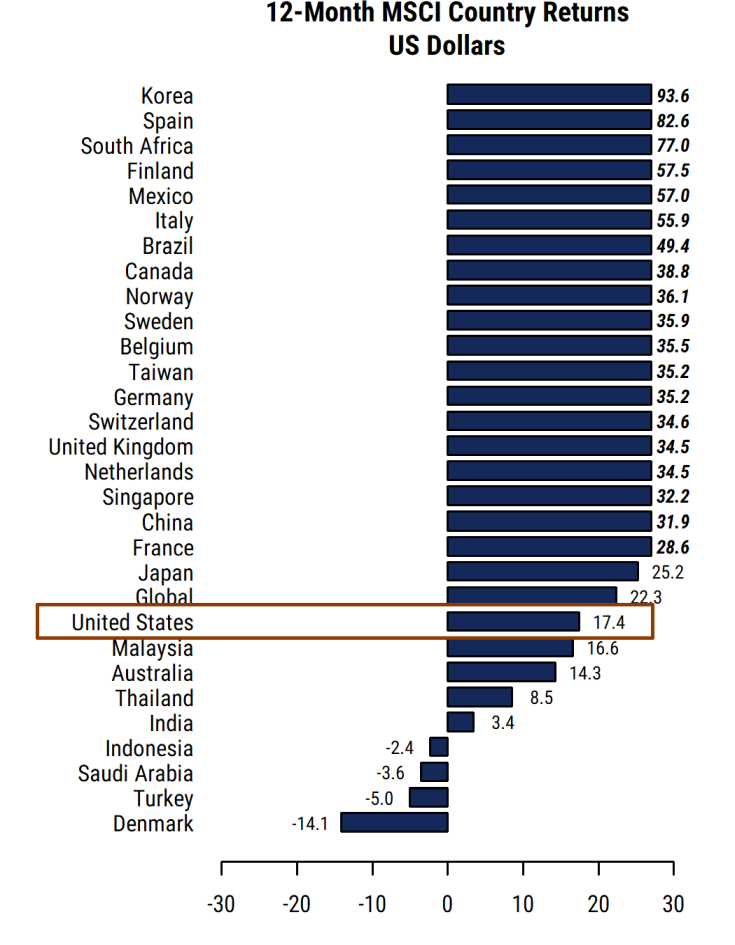
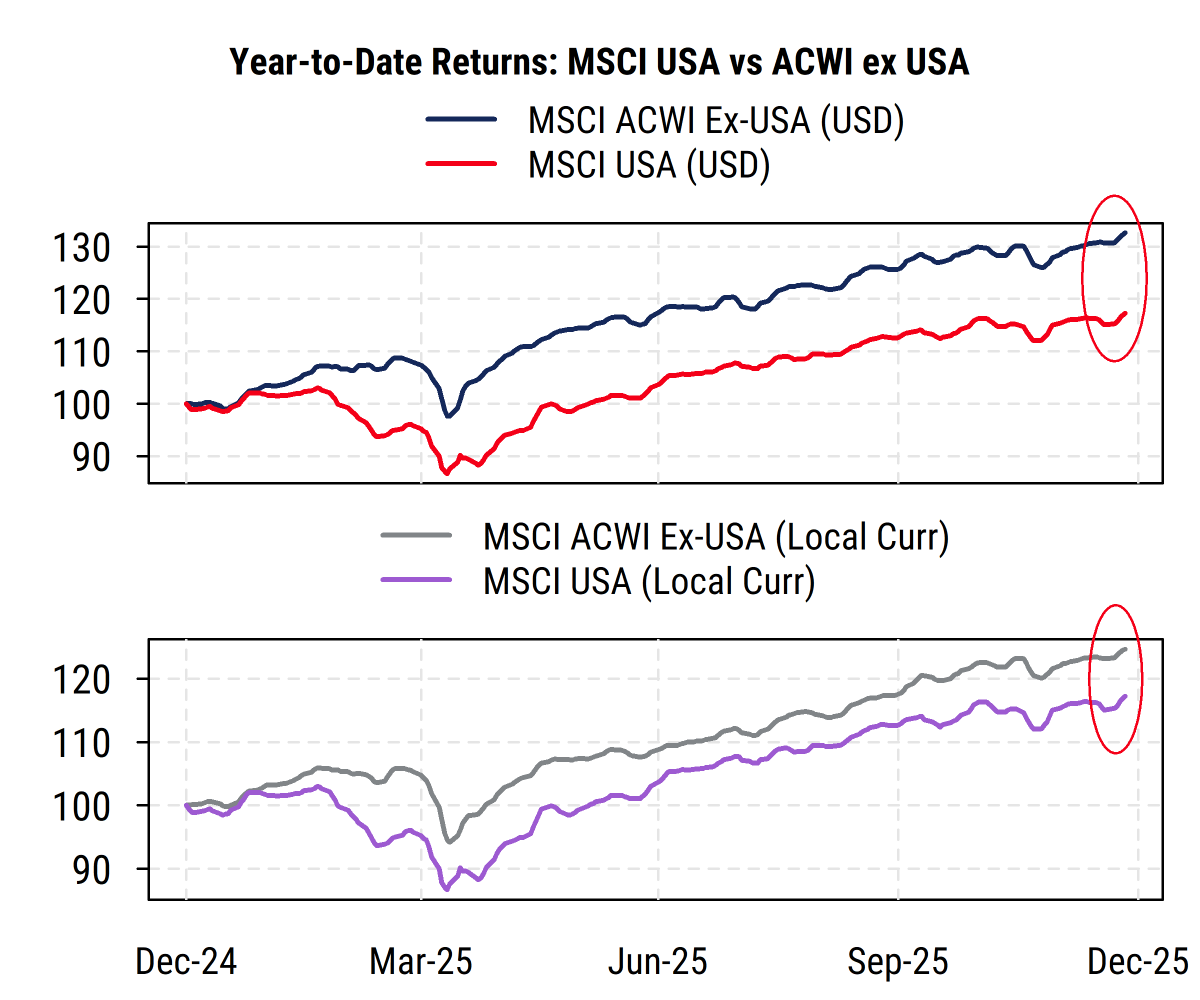
The US S&P 500 has lagged the rest of the world this year by one of the widest margins in many years in US dollar terms. The MSCI USA index (very similar to the S&P 500) returned 17.2% compared to the 32.6% return for the MSCI All-Country World Ex-USA Index in US dollar terms.
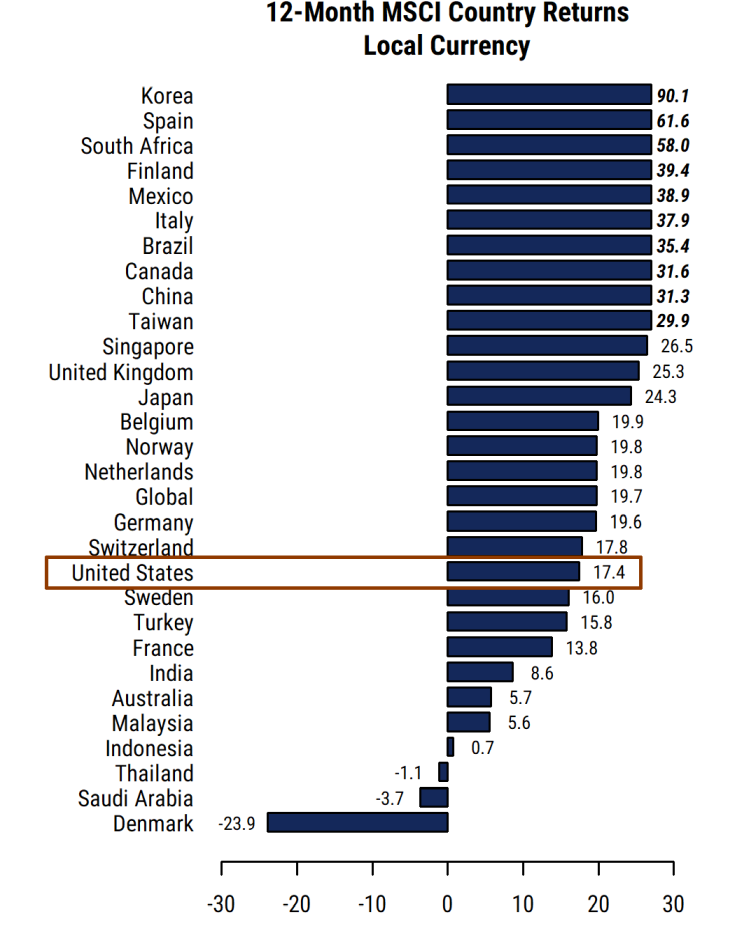
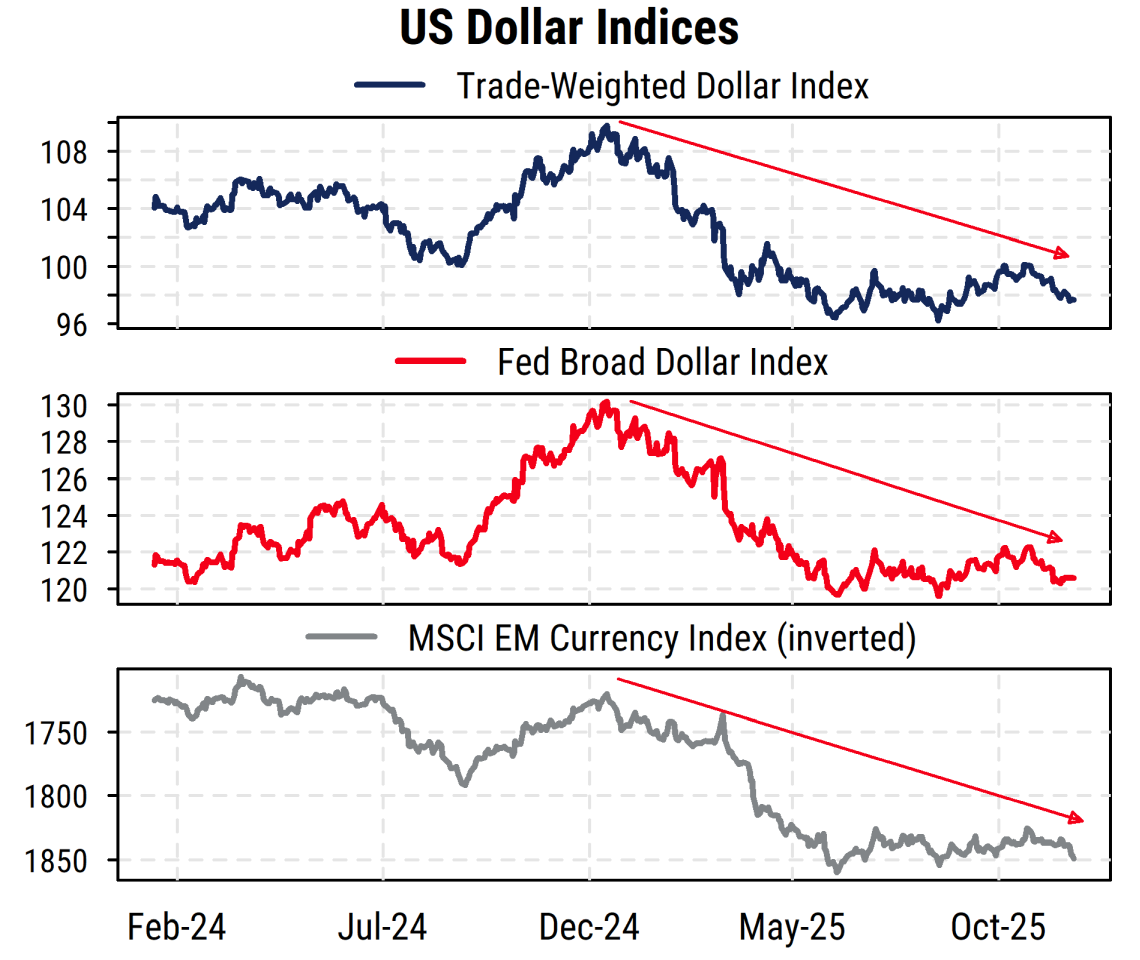
In local currency terms the return gap is narrower (17.2% vs 24.6%), as the US dollar has weakened substantially since Trump took office as well. A wide range of countries had equity performance better than that of the US, in both local currency and US dollar terms (returns in the top two charts below are standard 12-month returns, which differ only marginally from year-to-date returns).
Source: Mill Street Research, Factset
Rest of the world finally catching up
Does the US stock market underperformance this year reflect bad US earnings and economic performance? Not really. What we see is basically that US valuations are fairly high and thus “good news is priced in”, and the rest of the world (which has been much cheaper), is catching up somewhat to the US on a valuation basis. That is, the US is not doing badly (in terms of large-cap corporate earnings), it is just expensive, and other countries are doing better (in aggregate) than expected, and investors have reflected increased US risk by selling the US dollar.
As shown in the chart below, the US S&P 500 next-12-month (NTM) P/E is little changed from the start of the year, at 22.4 now versus 21.9 at the beginning of January: a 2% increase. However, the MSCI EAFE index (developed ex-US) P/E has risen from 13.8 to 15.4 (a 12% increase), and the MSCI Emerging Markets index P/E has risen from 12 to 13.3 (an 11% increase). Thus the US relative P/E has declined versus both EAFE (developed ex-US) and Emerging Markets.
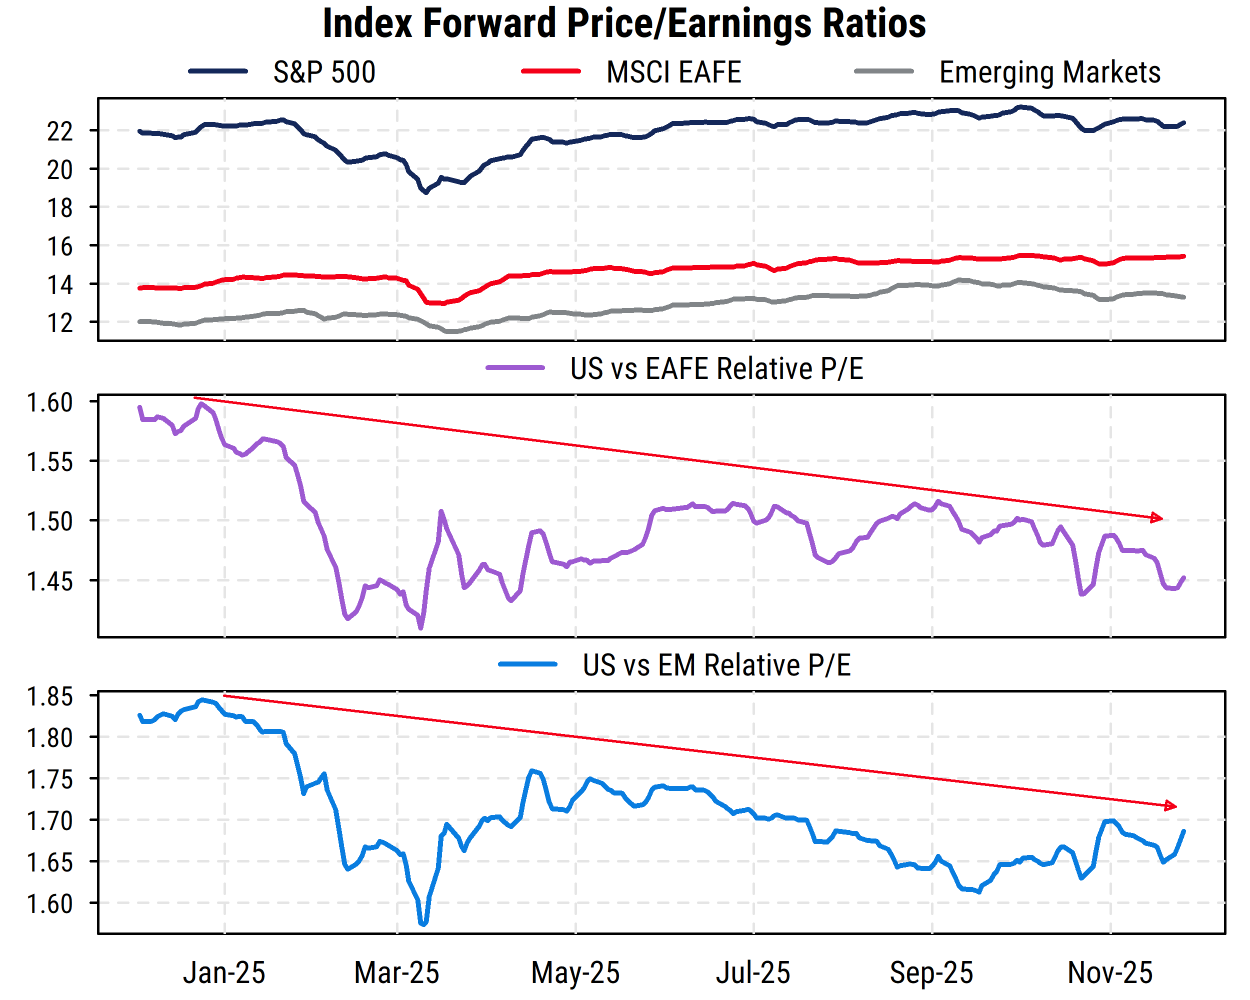
Source: Mill Street Research, Factset
Earnings in the US have continued to grow, helping support the elevated US valuations. The consensus estimate for S&P 500 earnings for the subsequent 12 months at the start of 2025 was $270.98, and the latest figure for the next 12 months is $308.60, or 13.9% higher. Thus most of the return for large-cap US stocks came from higher earnings rather than valuation multiple expansion this year.
And after a bumpy period, there have been more signs of earnings growth in EAFE markets and emerging markets (chart below). Combining all ex-US markets together, the forward 12-month consensus EPS estimates for the MSCI ACWI Ex-US index rose by 15% this year. By comparison, during 2024 the S&P 500’s forward 12-month estimate rose 12.3%, while the Ex-US index estimate was essentially unchanged. So ex-US earnings forecasts are now growing at least as fast as US earnings, and so there is less reason for such a large valuation difference between the US and ex-US stocks.
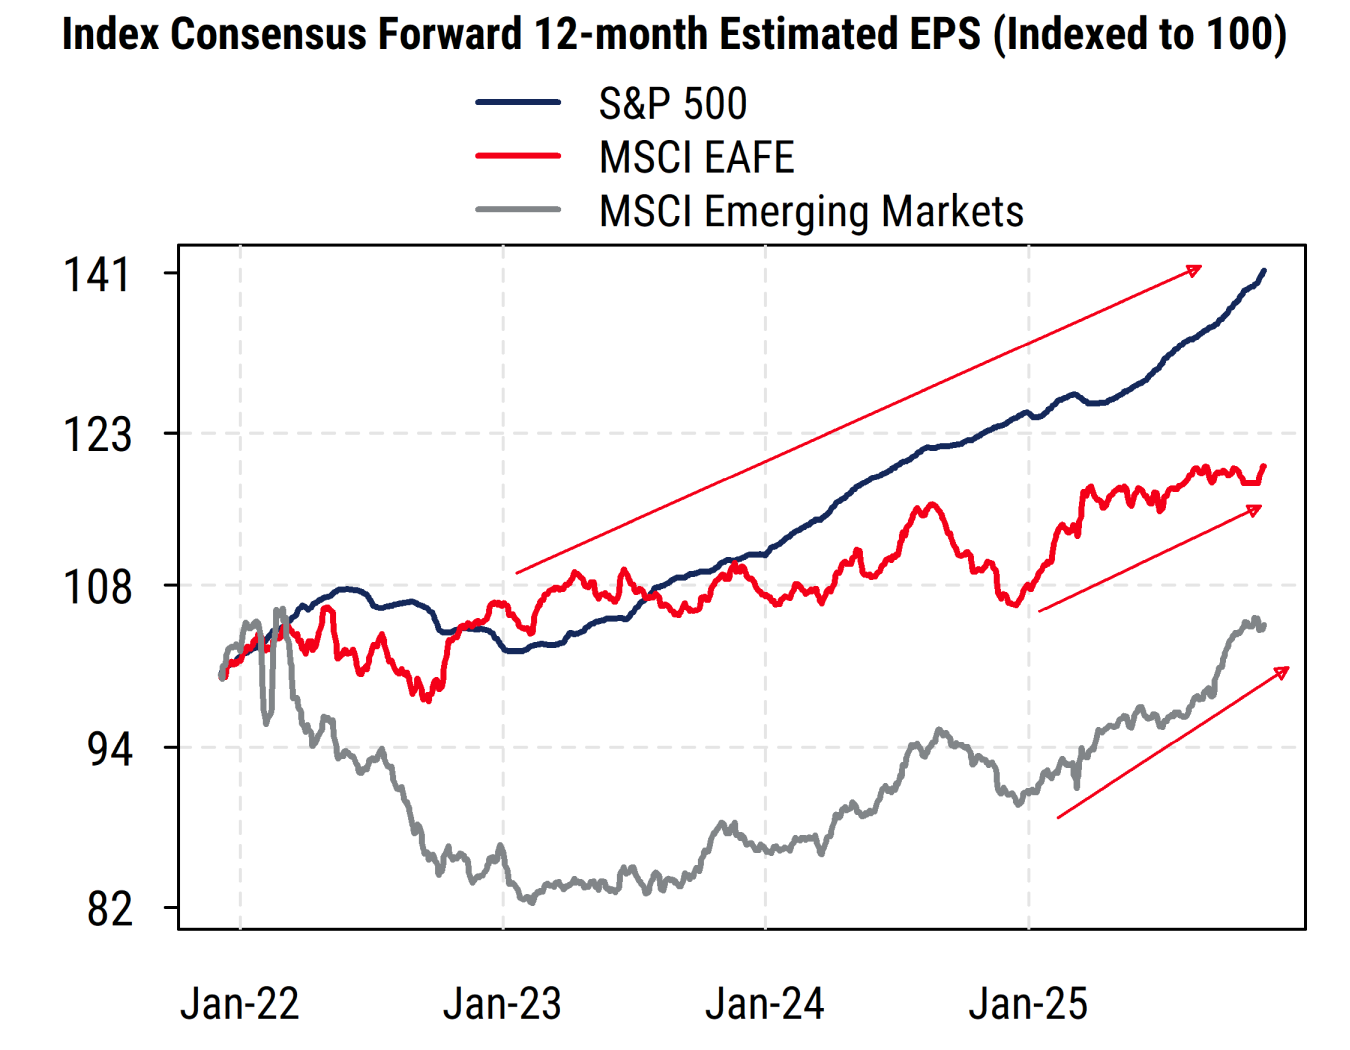
Source: Mill Street Research, Factset
Macro factors affecting earnings – not just tariffs
Tariffs have dented but so far are not derailing EPS growth, especially for the US mega-caps. The actual effective tariff rate has surged and is far higher than it has been in many decades, but is nevertheless much lower than the actual statutory rate implied by current policy. And the impacts of tariffs have both taken time to be visible in the economy and been unevenly distributed. This is due to the many exemptions and exclusions in tariffs (especially for big Tech companies), actions by companies to avoid them (sending products through lower-tariff countries), spotty enforcement, and lags caused by companies pre-buying ahead of tariffs or using existing inventories to mitigate the impacts. Smaller US companies, mostly manufacturers and importers, are feeling more of the effects but are less represented in the major equity indices.
Why have earnings held up despite tariffs and other bad policies? Easier monetary policy is helping, with the Fed resuming rate cuts in September after a long pause for much of the year due to policy uncertainty. And the weaker US dollar is in fact a currency tailwind for earnings of US multinationals (overseas earnings are worth more US dollars).
The jump in tariff (tax) collections has caused the US federal deficit (fiscal policy) to narrow relative to GDP this year, but it is still running around 5-6% of GDP, notably more stimulative than most of the 2013-2019 period. Fiscal policy, along with immigration and soon health care policy, are heavily focused on benefits for high-income households and large companies, at the expense of lower-income households and smaller companies. And the ludicrous fantasies of DOGE saving the government money have been exposed as a catastrophic fraud.
Globally, meanwhile, European fiscal policy is trying to be more supportive (especially for defense against Russia), and rate cuts in Europe are helping earnings some. And Emerging Markets earnings are being helped by places like Korea and Taiwan (benefiting from Tech/AI demand), while Japan has increased its focus on shareholder returns in recent years. China remains a weak spot globally, facing continued economic headwinds.
US policy risk remains extreme
And while there has been some pushback from courts, states, and companies, US (Trump) policy risk remains very high. The chart below shows a measure of US economic policy uncertainty measured by newspaper article references to related keywords, produced by Baker Bloom and Davis. While off its post “Liberation Day” tariff spike in April (which matched the spike when COVID first hit in early 2020), it remains at historically high levels, well above the peaks seen in the Great Financial Crisis and the subsequent period (European debt crisis, etc.). So US policy uncertainty by this measure has been higher for longer than we saw following a global pandemic, and the current uncertainty is entirely man-made (largely by one orange-hued man in particular) but could well continue at least until the US mid-term elections in November. Thus global investors have to consider this risk when deciding where to allocate funds, which includes US equities, fixed income, and the currency itself. So some of the underperformance of US equities can likely be attributed to policy risk. And the dollar’s weakness is almost certainly showing a big impact, particularly since US rates have remained relatively higher than other developed markets and thus should have normally been a reason for a stronger dollar.
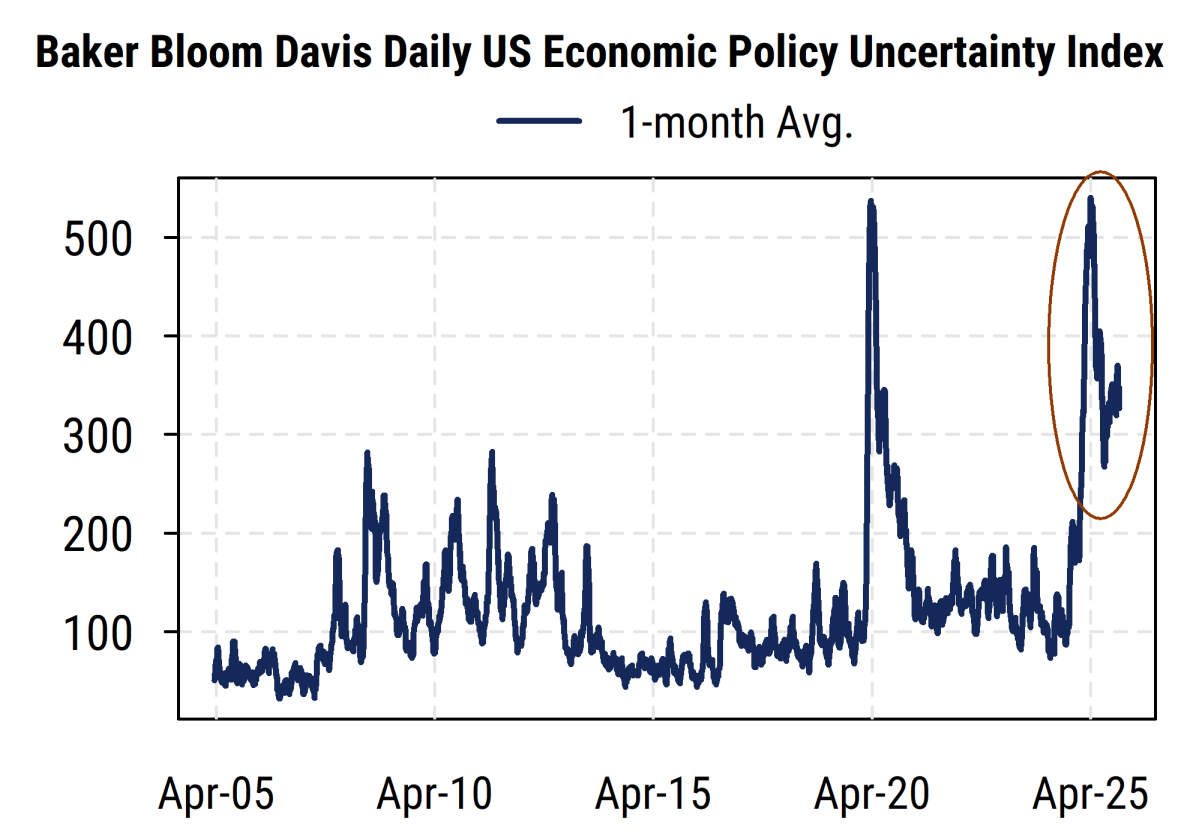
Source: Mill Street Research, Bloomberg, Baker Bloom Davis
Concentration risk in the US has also surged
But another risk global investors are likely considering is the drastic rise in relative index concentration for the US versus other developed markets (MSCI EAFE Index). As shown in the chart below, the weight of the top 10 stocks in the S&P 500 has surged to about 40% (from less than 20% 10 years ago), compared to just 13% for top 10 stocks in the MSCI EAFE index (which has about 700 constituents). Thus a bet on the S&P 500 brings a vastly more concentrated bet on a few US mega-caps (mostly Tech-related) than is the case for developed ex-US index investors (or was the case a few years ago). I know from discussions with global portfolio managers that they are acutely aware of the lack of real diversification in the major US indices, which carry a heavily concentrated bet on few US Technology and AI-related companies along with the macro policy risk under the Trump regime.
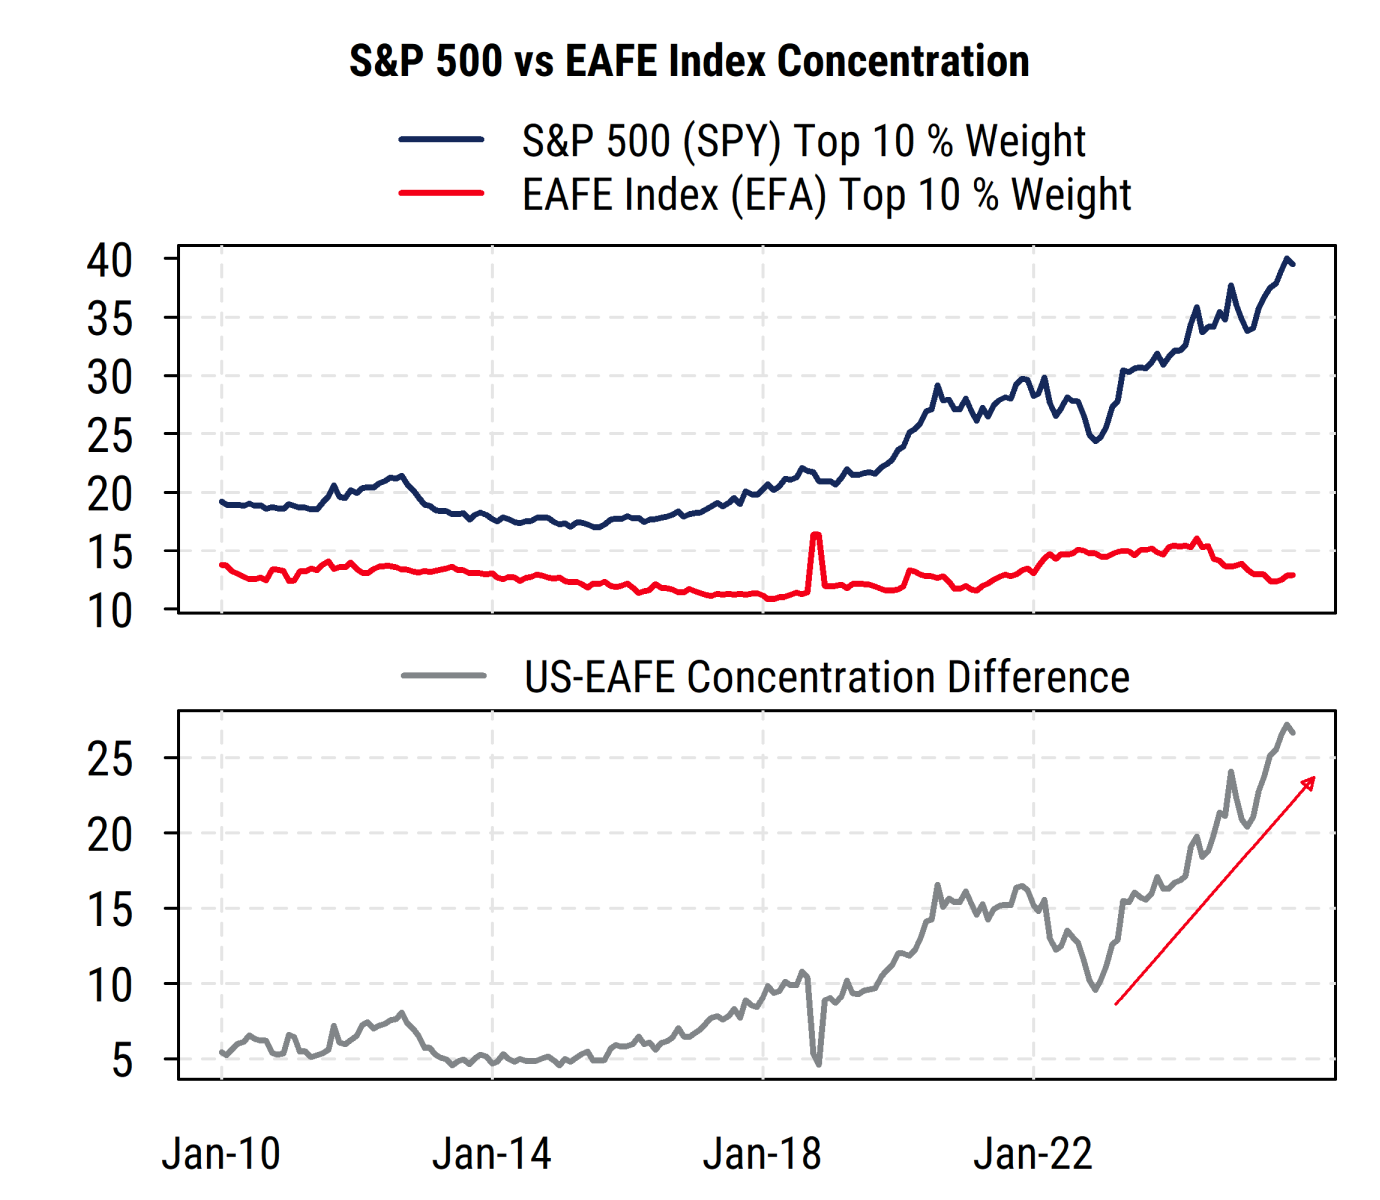
Source: Mill Street Research, Factset
Balance of risks for global equities no longer favors the US as decisively as before
So global investors must balance the positive aspects of the strong growth and dominance of the US mega-cap leaders with the surging concentration risk in both number of companies and their industry exposure. After several years of much weaker earnings growth, ex-US companies in aggregate are now starting to show better results and thus investors are willing to pay somewhat higher multiples. US (S&P 500) multiples have long been much higher than ex-US multiples, and are also high relative to their own history, so there is less room for multiple expansion at this point.
US stocks will likely continue to rely more on earnings growth (which remains strong) than valuation expansion to drive future gains, while ex-US stocks will need to show investors that the better earnings trends in recent months are not just a temporary rebound but can continue in order to be awarded persistently higher valuations.
Our work shows that while analysts are raising estimates outside the US more than they were earlier this year, they are still raising estimates more broadly for the S&P 500 than for ex-US stocks, with Canada and Japan also showing above-average support from analysts. Europe, the rest of developed Asia, and much of the Emerging Markets universe (especially China) are relatively weaker on our metrics. So the earnings fundamentals keep us tilted toward North America and Japan in our regional equity allocations, and underweighting Europe, Asia ex Japan, and China. But those tilts are smaller than they would otherwise be due to the valuation, policy, and concentration risks in the US (Canada is also a heavily concentrated index but in Financials and commodities rather than Tech). The US had 15 years of nearly continuous outperformance versus the rest of the world and still has many advantages, but that trend may be bumpier going forward.
Sam Burns, CFA
Chief Strategist