It has been an eventful year so far, and the backdrop has changed a lot since the end of February. Below is an overview of some of Mill Street’s recent comments on the market outlook, capturing both our proprietary model output and qualitative macro views.
Risk appetite and trend weakening rapidly amid geopolitical risk, model now neutral, cutting equity exposure
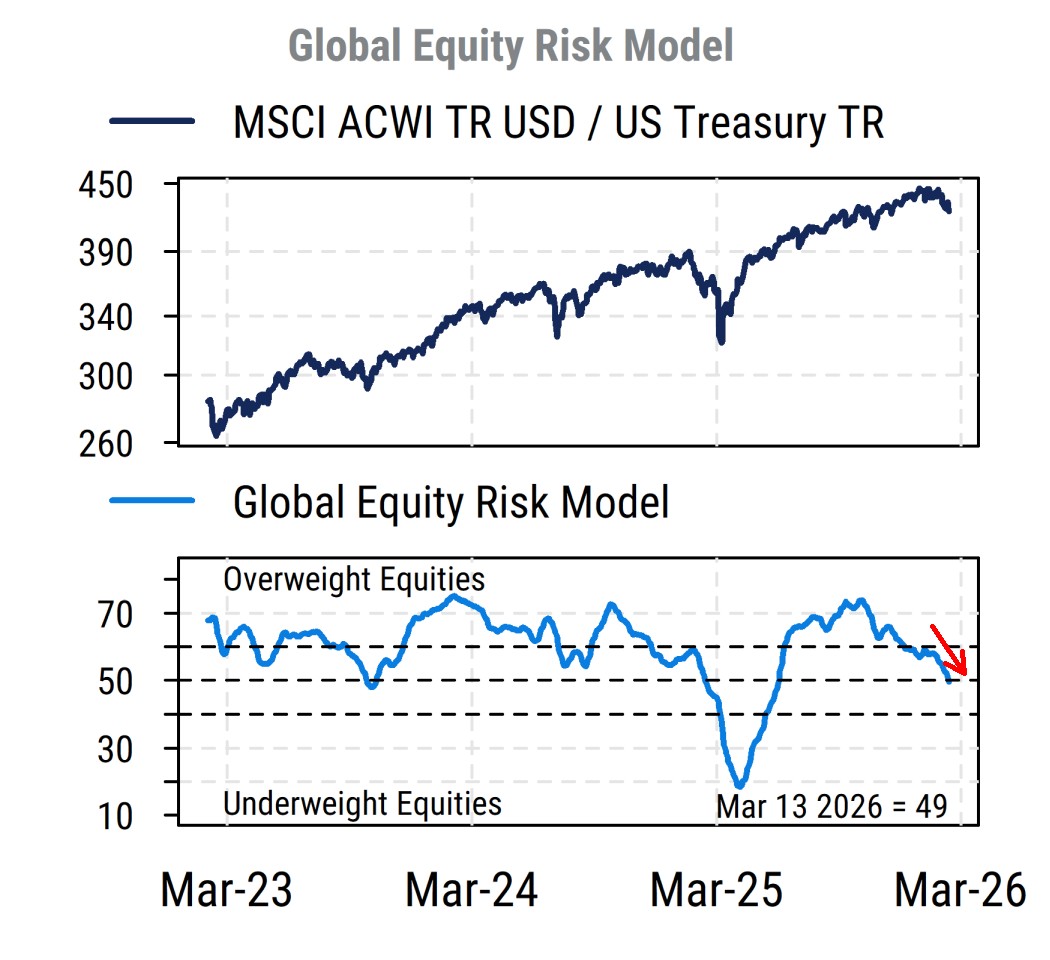
Our Global Equity Risk Model (ERM), which anchors our 1-3 month market view, has deteriorated significantly in the last few weeks, largely due to weakening risk appetite and price momentum. While there were some signs of that earlier, the bizarre war with Iran has accelerated the trend and damaged the outlook.
The message from our Global Equity Risk Model, and market behavior in general, is that until the end of February, investors had wanted to keep money in equities but were aggressively rotating from last year’s winners in Big Tech toward last year’s laggards amid worries about AI and excessive concentration.
Since the Trump administration took the bizarre and extremely poorly-thought-out decision to start a war with Iran (joined by Israel, but no one else) at the end of February, geopolitical and market uncertainty has surged (again) and this has caused a sharp deterioration in investor risk appetite. Many of the negative effects of a war with Iran that have been discussed for years, including the closure of the critical Strait of Hormuz, are now occurring, and there is clearly no plan for this war or how to address the major issues with energy supplies and many other crucial goods that flow through the Middle East (including people, as air travel in the region is severely curtailed).
Some key points from our indicators:
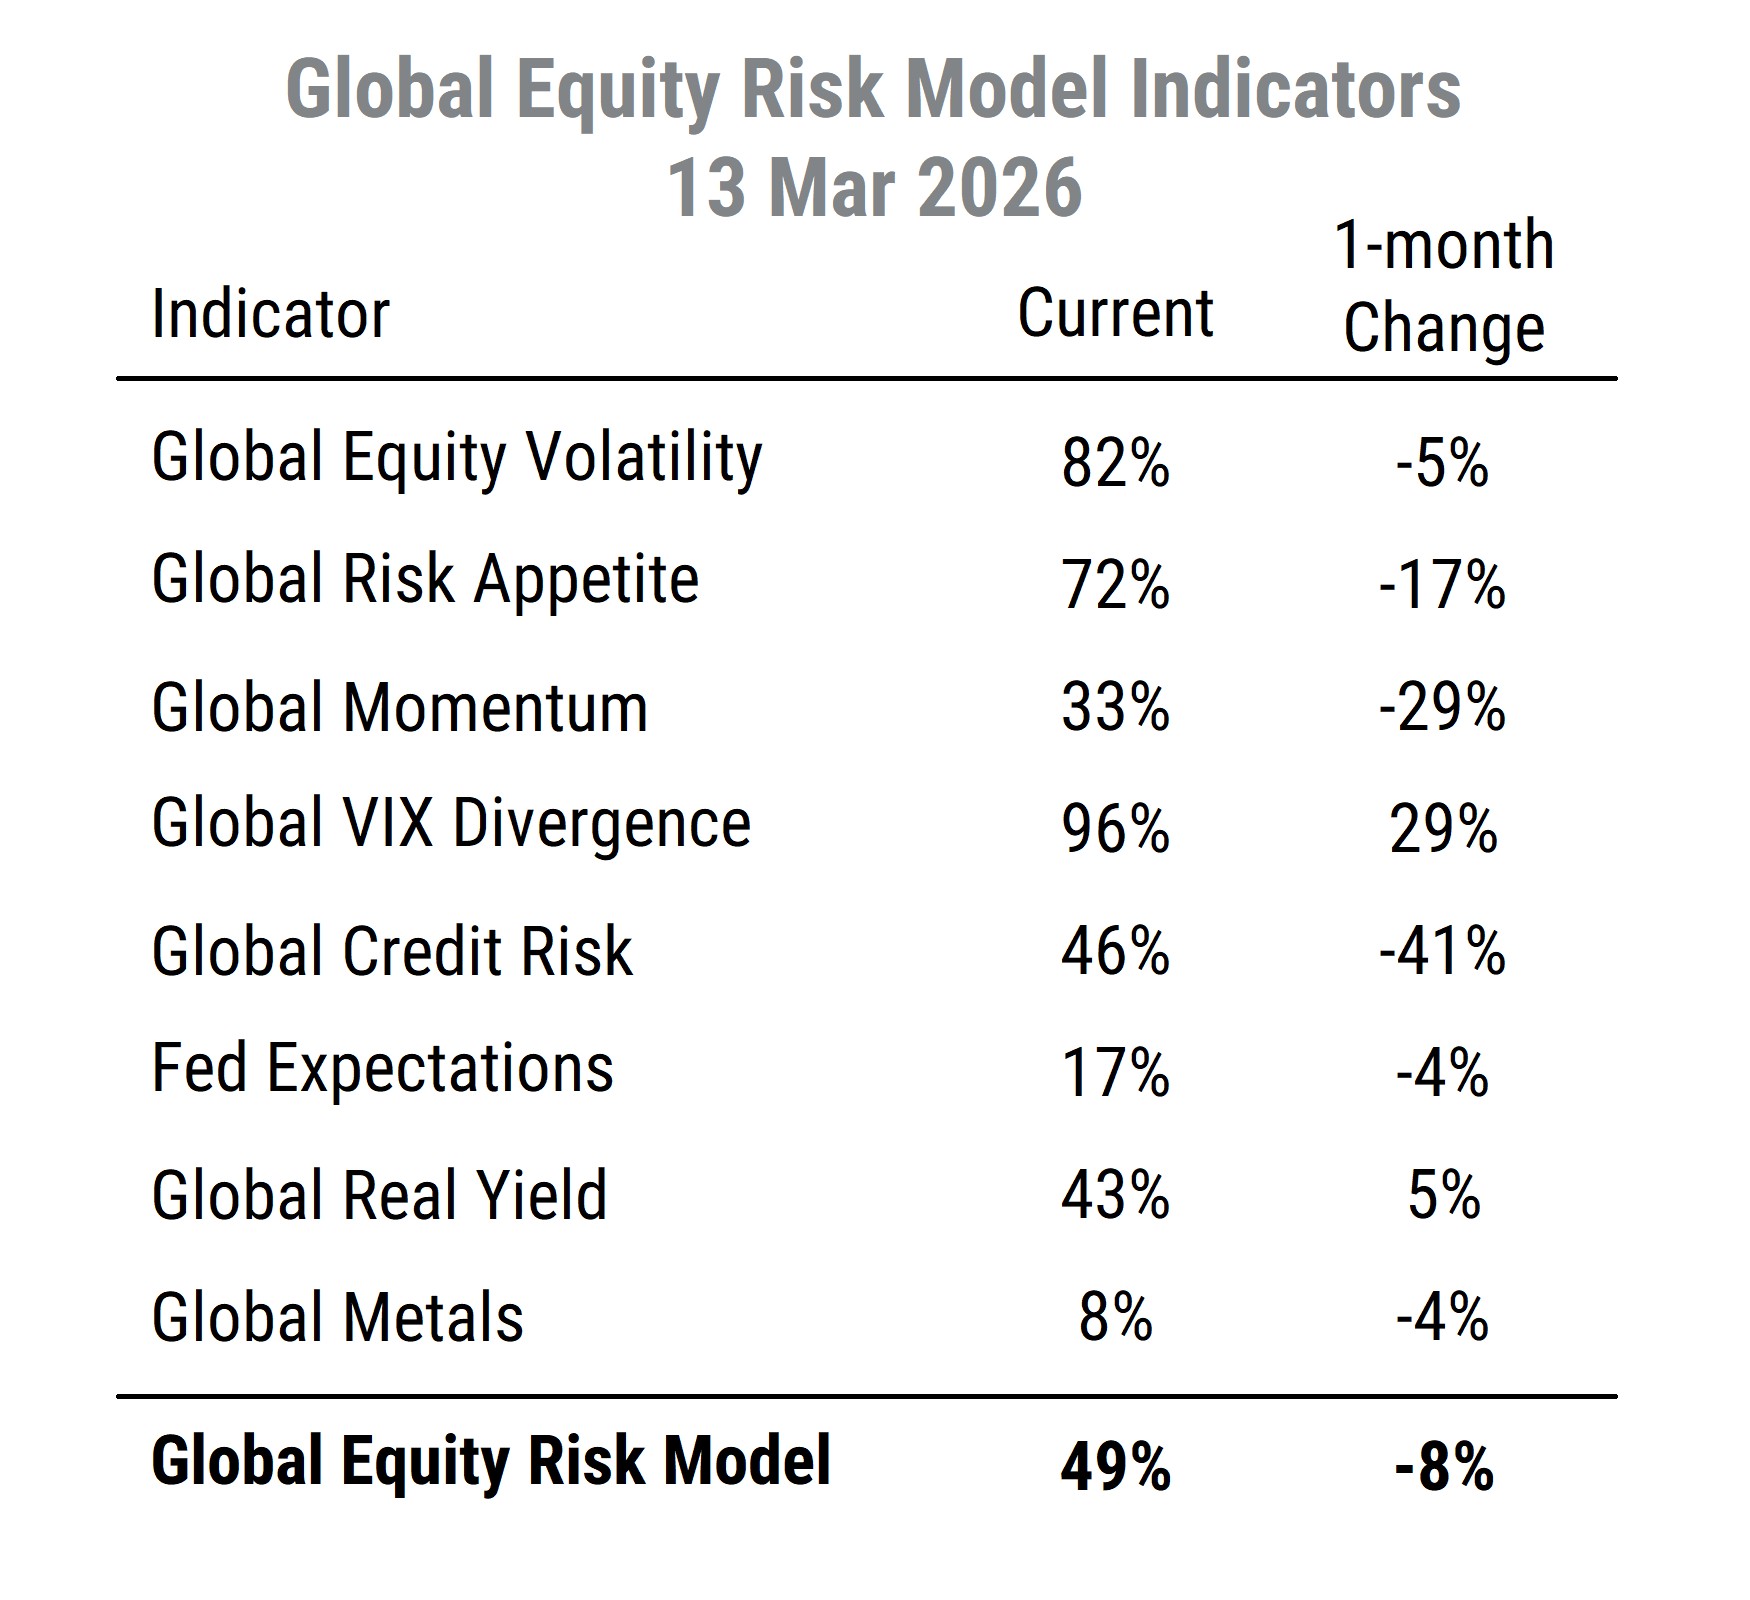
- Our Global Momentum indicator, which tracks risk-adjusted return trends in the MSCI ACWI index, was already declining in February, and is now below the important 50% level (i.e., net bearish). Our Risk Appetite indicator, which tracks the performance of high-volatility stocks globally, is falling from earlier very strong readings now. And our Credit Risk indicator (capturing the trend in corporate bond credit spreads globally) is also weakening rapidly and has crossed below 50% (also net bearish now).
- The strongest indicator in the model is now the VIX Divergence input. The VIX Divergence indicator is a contrarian sentiment indicator based on the gap between market implied and recent realized equity index volatility. The VIX has been quite high compared to actual market volatility lately, which is a favorable contrarian sign. And our indicator based on actual Equity Volatility is still favorable but gradually deteriorating as market volatility has picked up recently.
- The geopolitical risks and rising inflation pressures from the Iran war will keep the Fed firmly on the sidelines, and other central banks (including the ECB) are considering rate hikes now. So monetary policy, already less of a support, is clearly not going to help unless markets become dysfunctional.
- Earnings estimate activity is still supportive, and the net earnings impact on S&P 500 EPS is hard to determine given the relatively lower exposure to energy risks that the US has compared to other countries.
If risk appetite and rates are no longer supportive, it is harder to make a case for being overweight equities, so we have downgraded our equity allocation to no more than benchmark, and added to cash, still favoring cash (short duration) over long duration bonds.
What about valuation? Our Implied Growth model is high and creeping higher as bond yields rise on inflation, credit worries
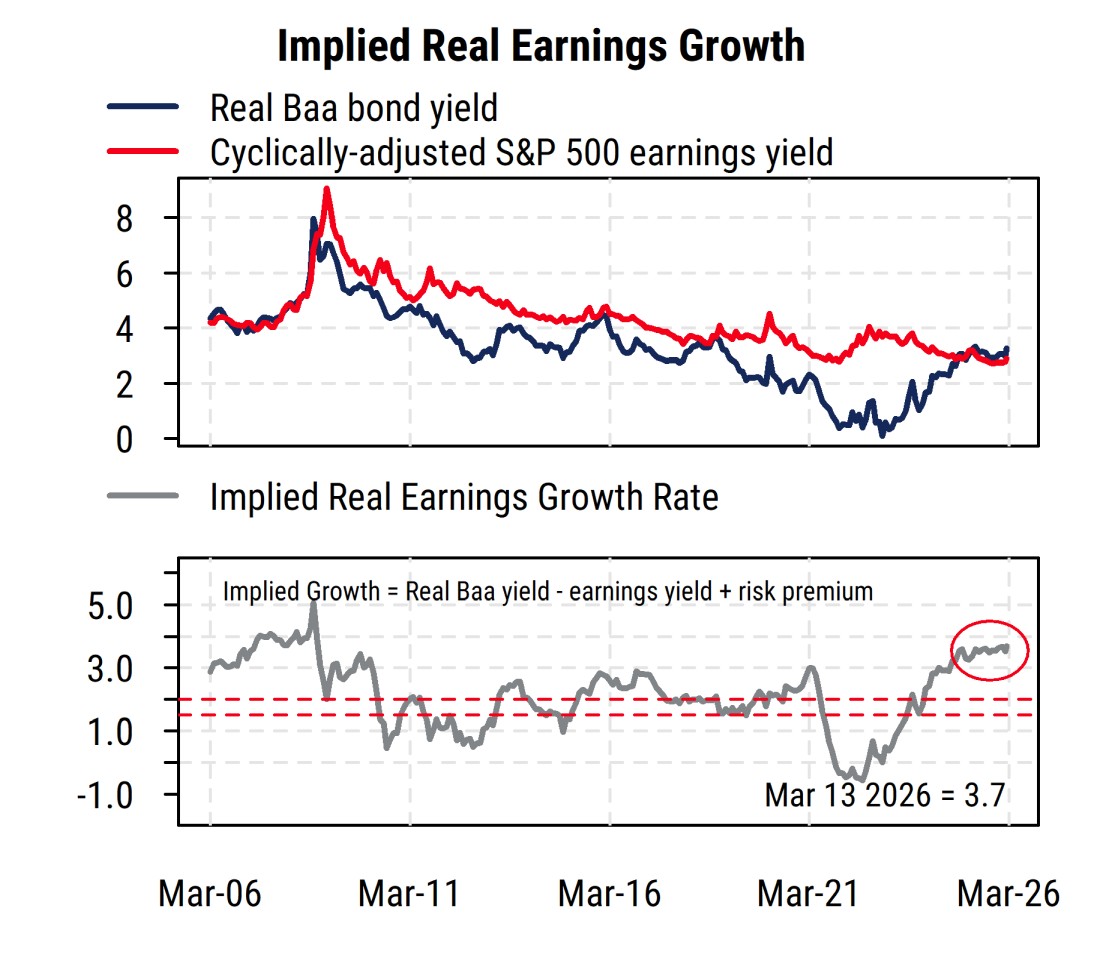
Our Implied Growth model, which drives our longer-term stock/bond relative valuation view, has edged even higher lately despite the renewed threats to US and global economic growth. Higher corporate bond yields are the main driver.
The Implied Growth Model has been elevated near its highest readings since 2007 for months now, and moved a bit higher since last month despite the decline in the S&P 500.
A key feature of the recent pullback in stock prices and risk-off tilt in general has been the lack of any buying of bonds as a safe haven. Treasury yields have been rising rather than falling as investors worry about the inflationary impact of the surge in energy prices and other goods tied to the chaos in the Middle East. The Fed and other central banks are very unlikely to want to cut rates under current conditions, with some (Australia and European Central Bank) considering possible rate hikes.
In addition, as noted above, credit spreads on corporate debt have widened from their recent very low levels amid the general pullback in investor risk appetite. So the Baa corporate bond yields we use in the model have risen more than benchmark Treasuries have. So far, the rise in bond yields has outweighed the rise in the normalized equity earnings yield, so our Implied Growth reading has risen since last month.
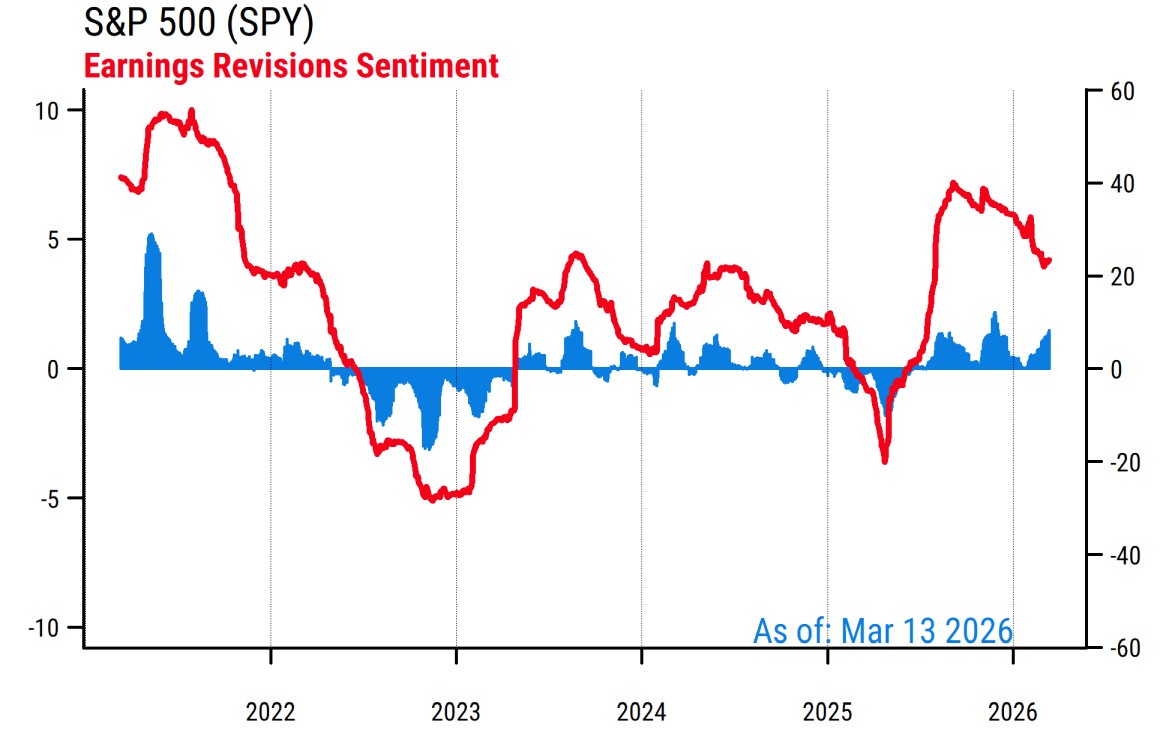
It has been less than three weeks since the war with Iran started, and analysts are likely struggling to figure out how long the current disruptions will last and how to incorporate the impacts into their earnings models. The overall index estimate trends for the S&P 500 remain positive, particularly since Big Tech is much less directly impacted by higher oil prices, etc. Earnings estimate revisions breadth for the index (the net proportion of analysts raising versus lowering next-12-month EPS estimates) is easing but not dramatically.
The US economy has been doing relatively well despite the many Trump policy mistakes, but it is unclear how much of a hit the Iran war will cause. And the surge in military spending alongside the likely reduction in tariff collections after recent court rulings will mean the US federal deficit will widen. This is arguably the “bad” kind of stimulus (paying to drop bombs instead of build factories or provide health care), but it is still “money printing”. Upward pressure on inflation and interest rates is a key concern, but likewise depends on how long the current conflict lasts.
Debacle in Iran causing reassessment of risks, much harder to serve TACOs now
The bizarre and unnecessary new war with Iran has injected another big dose of uncertainty into the market and economic bloodstream. Unlike tariffs, wars are harder to unilaterally stop (even if “Trump always chickens out”, i.e. TACO). Equity valuations have come down somewhat but still suggest most expect a rapid reversal.
While one might think a historically unpopular president with his party facing a difficult mid-term election would want to avoid doing the exact opposite of his major campaign platform (“no new wars”, “bring down energy prices”) and start a war that no one (well, almost no one) wanted, that has turned out to be wrong.
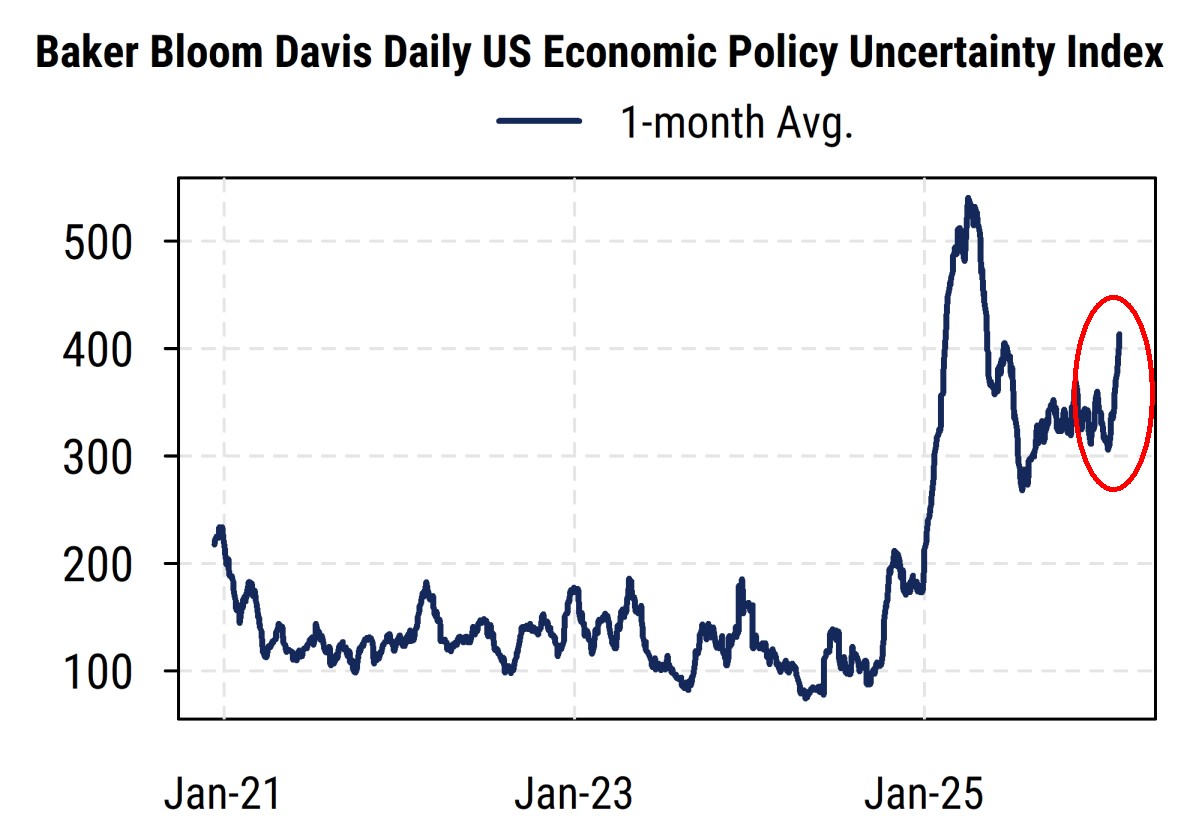
Our analysis is not meant to focus on the global humanitarian and security debacle we now face, but instead look at the market and economic impact. While hard to quantify, recent events have no doubt sharply increased investor, consumer, and CEO uncertainty about the economy and policy. So it is little surprise to see that the Baker Bloom Davis index of US economic policy uncertainty based on analysis of news articles has turned back up again (chart below). Of course, it never fully recovered from the historic surge after the “Liberation Day” tariffs hit, as policy has not exactly been stable since then. It remains higher than it was at any time around the Great Financial Crisis, and is still near levels hit during the worst of the initial arrival of the COVID-19 virus.
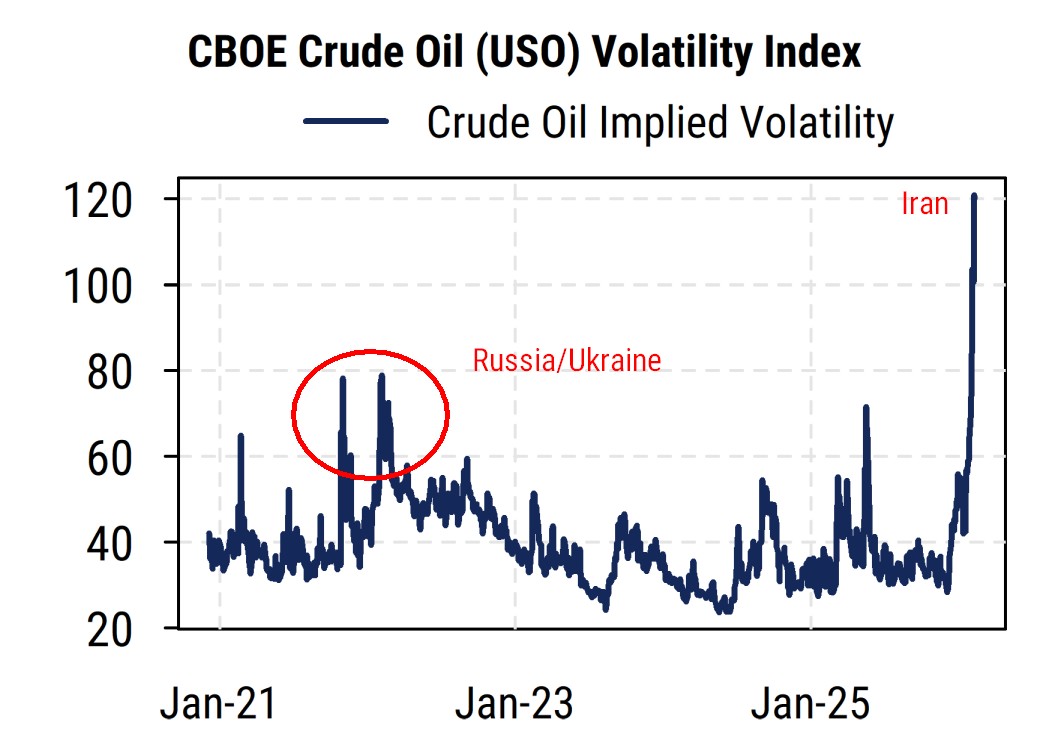
The attacks on Iran and the subsequent cuts to oil production and shipping in many countries in the Middle East has not only caused oil and other energy prices to rise, but also volatility (realized and implied) to skyrocket. The current “oil VIX” calculated by the CBOE based on the USO ETF option prices has gone far above the levels seen in 2022 when Russia invaded Ukraine and disrupted supplies then. As discussed below, markets currently expect the Iran supply shock to fade within a few months. Based on some past events (Russia in 2022, the first Gulf war in 1991), that seems like a reasonable assumption, but each case is different and leadership now is clearly far worse.
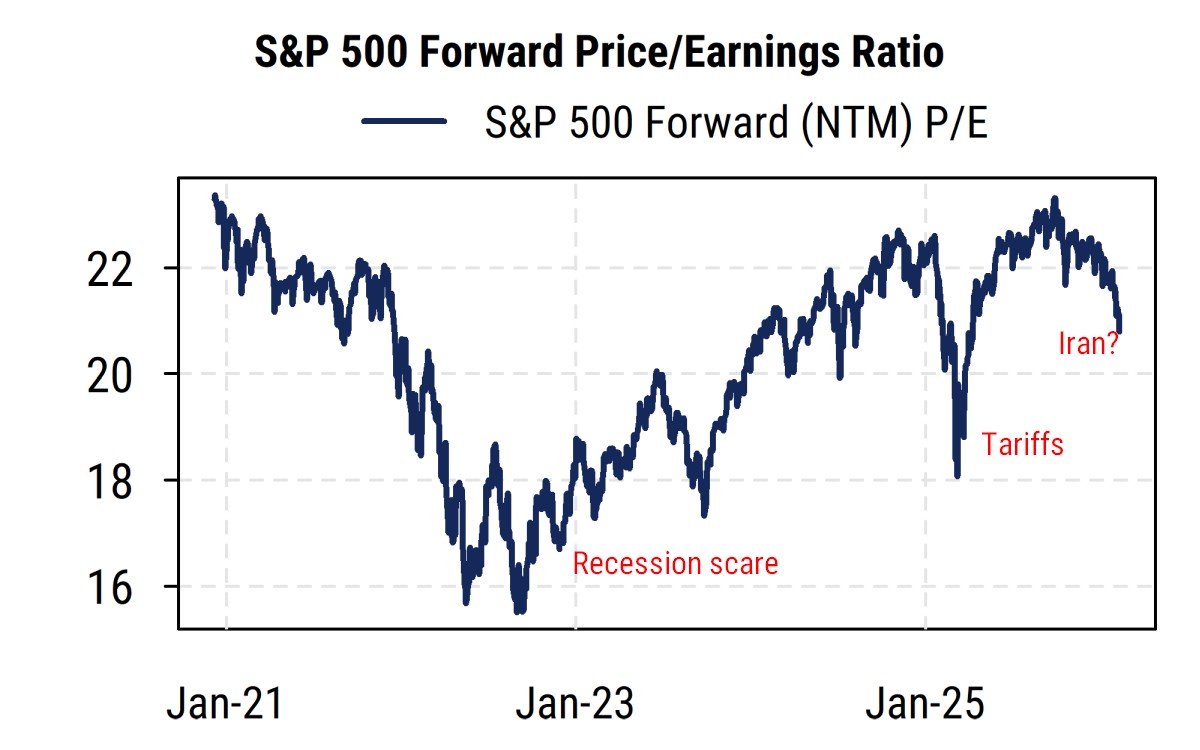
The impact on equities will be most felt in risk appetite and thus the multiples that investors are willing to pay for stocks. The forward P/E on the S&P 500 has come down somewhat from its recent peak, now about 21x next-12-month estimates. The April 2025 tariff shock pushed the P/E down much more than that, though only briefly as Trump could chicken out and partly reverse the worst of them unilaterally, which he cannot in a war with Iran. The 2022 recession scare (though no actual recession occurred, it was close) pushed multiples far lower (around 16-17x). Markets have so far remained relatively optimistic compared to the “tail risks” that one might contemplate, and earnings estimates in aggregate have so far held up. We hope this remains the case, but risks have risen and our indicators can no longer justify an overweight in equities.
The big question now: how long will it last? Markets think just a few months.
Most other data is being rendered irrelevant for now, as the only question that matters is “how long will the severe disruption in the Middle East last?”. Markets see no more than a few weeks or a couple of months of impact right now, but events are changing daily.
The response to a relatively tame February CPI report was instructive, as it seemed to be universal: while it was on balance good, it is immediately irrelevant given what has happened in March. So stocks and bonds did not have much of a response, and no one thinks the Fed will cut rates any time soon.
The only question now is how long the blocking of the Strait of Hormuz will go on, and thus how much of the world’s energy and other supplies will be offline. This of course then feeds into worries about inflation pressures via the direct and indirect effects from the supply shock. This includes prices of food, chemicals, other cargoes that go through the Middle East, airfares, and much more.
While I am not a specialist in Middle East geopolitics, it is clear that the US government under Trump has also gotten rid of most of the actual specialists in such matters, so the course of the war and its knock-on effects are even more unpredictable than usual.
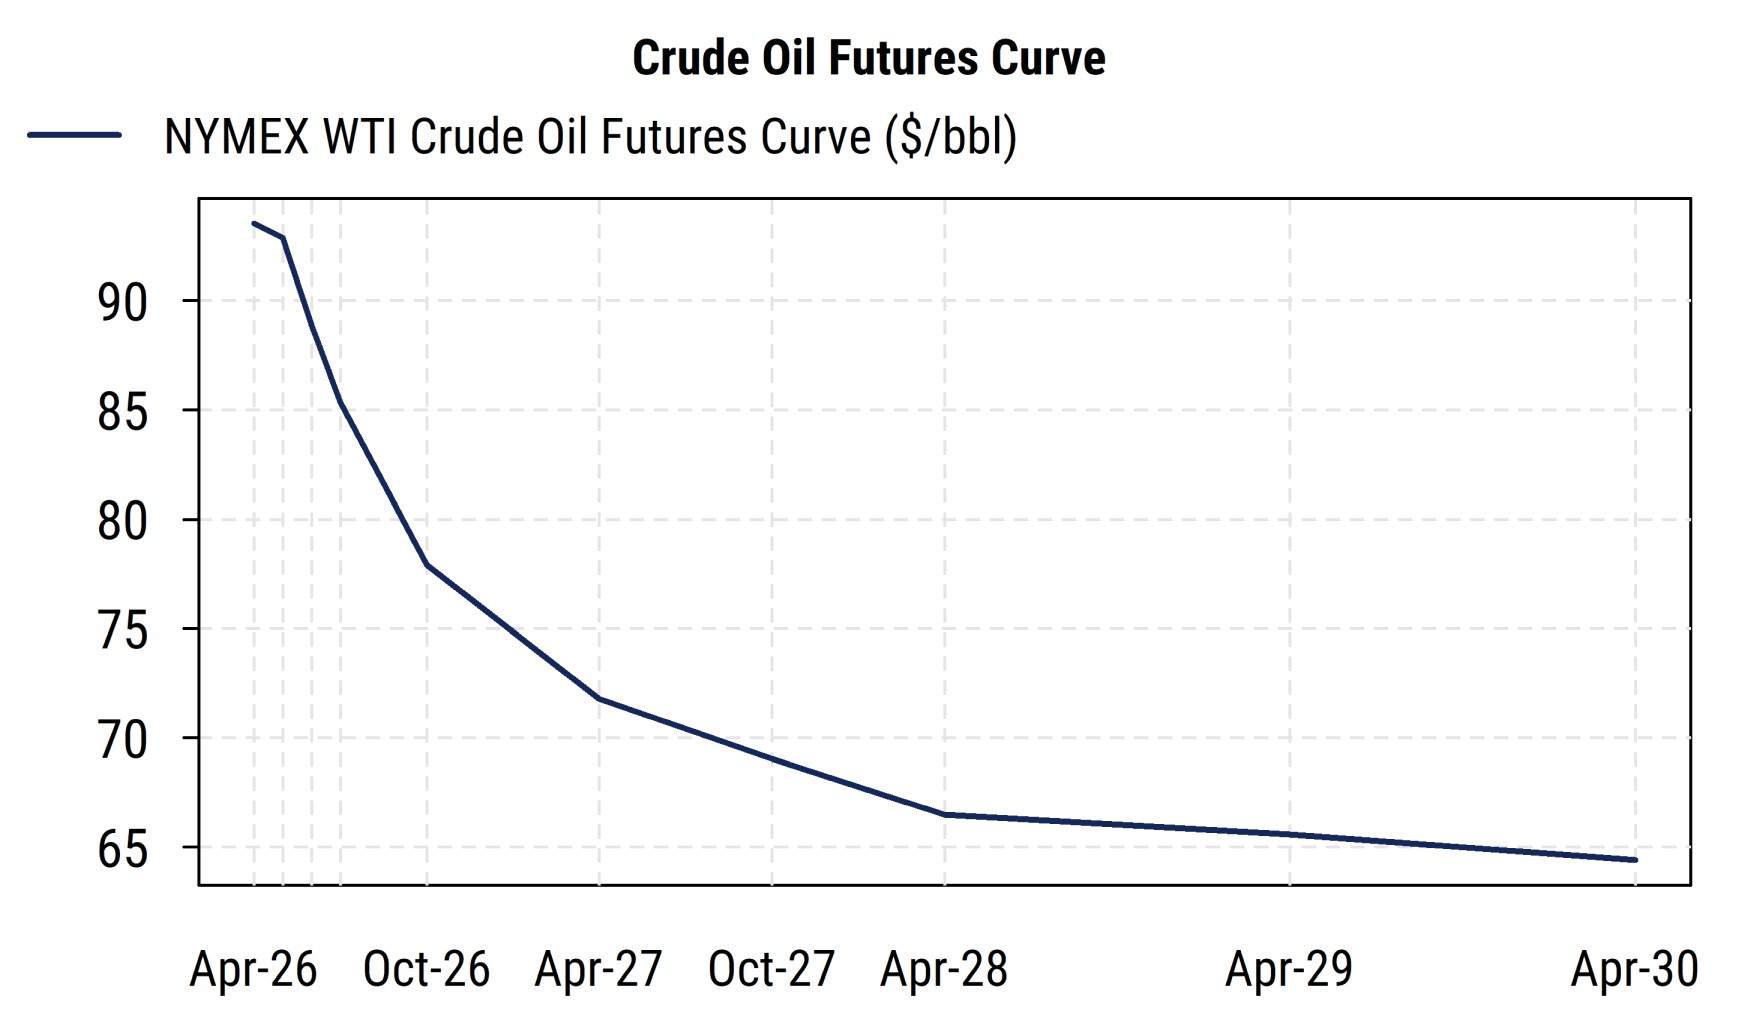
So everyone is guessing, but markets capture expectations as they evolve. The futures curve for crude oil (chart below) is of course front and center, and it is in severe backwardation now: future prices are far below current prices. The pricing suggests markets see the major supply shock only lasting a few months, with prices falling rapidly from current $95-100 levels to back to $80 by September, and about $70 within a year. So energy companies have little incentive to explore for more oil, but everyone will pay more in the near-term.
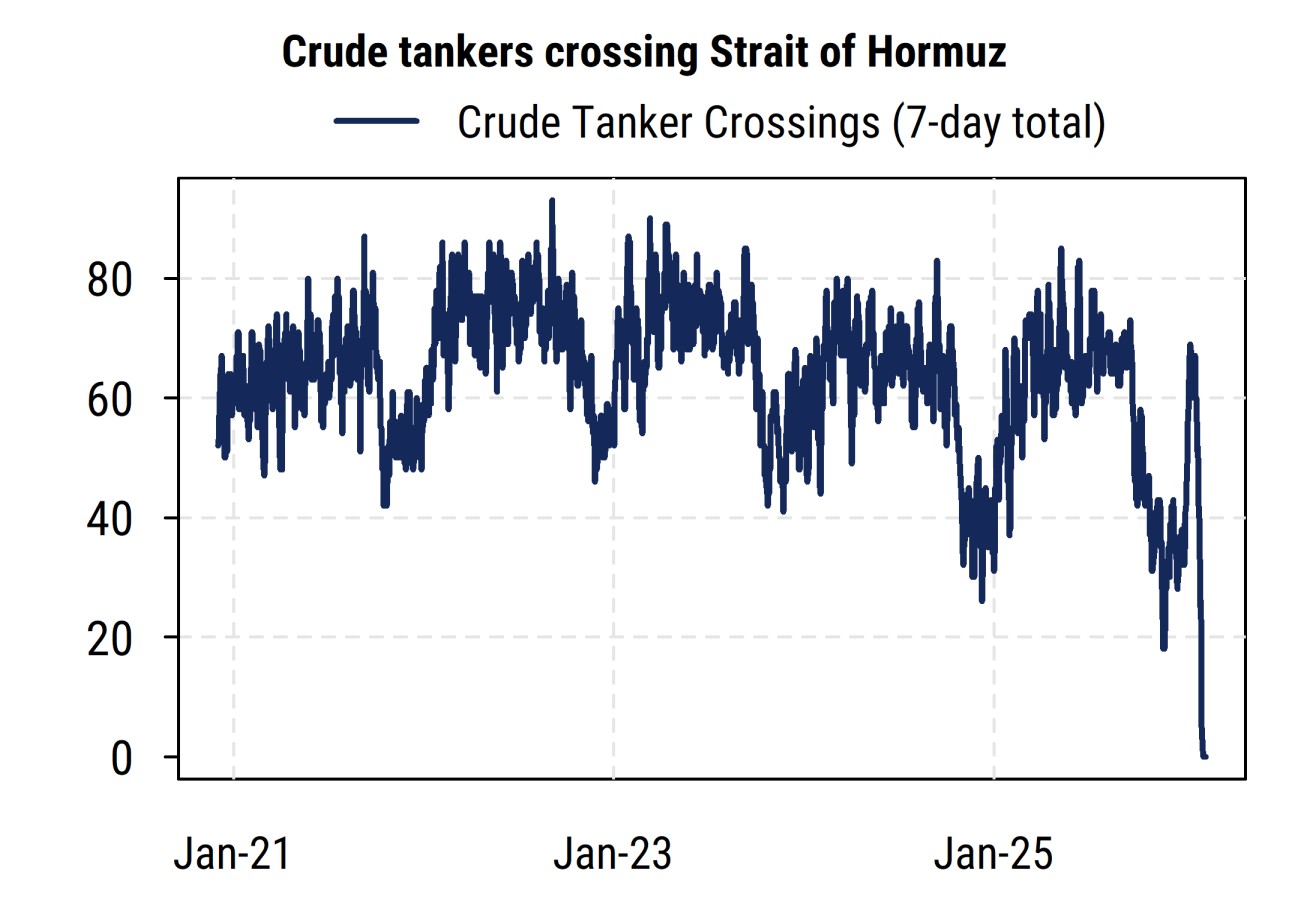
Much depends on how long the critical Strait of Hormuz remains closed. Bloomberg’s count of crude tankers crossing the Strait (chart below) has dropped to basically zero from its normal 60-70 per week. Until that normalizes, the supply shock will continue, since there are few ways around it in the short/intermediate-term.
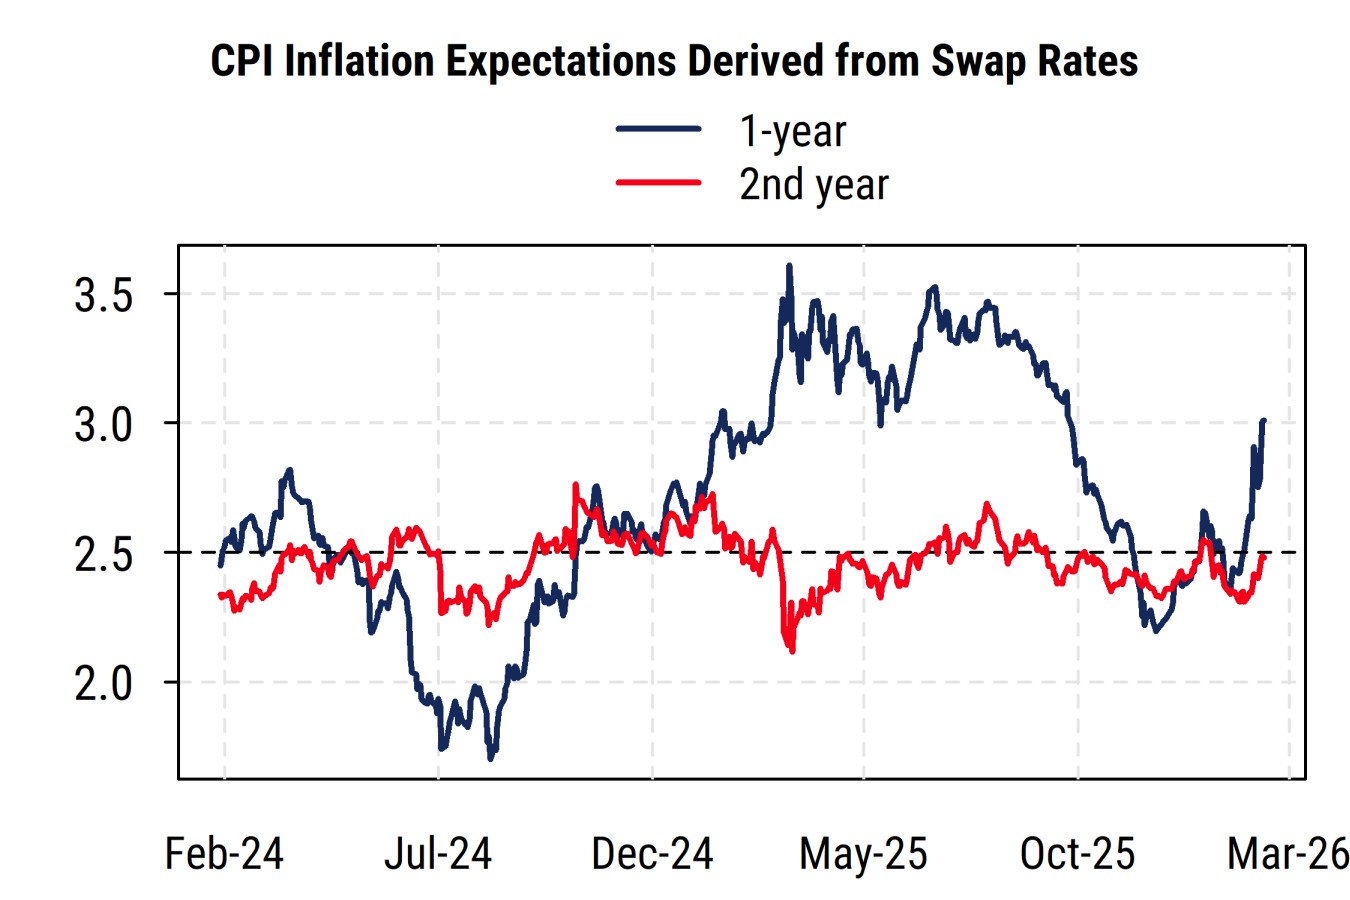
Inflation swap markets also see a significant short-term impact but only within the next year or so. The one-year CPI inflation swap has jumped to 3% from below 2.5% earlier (blue line, chart below). But the inflation rate expected starting a year from now (red line) has only risen modestly and is still near the Fed’s 2.5% target.
Thus markets see this in some ways like Russia’s invasion of Ukraine in 2022: a real problem for a little while (but less for the US vs other countries), but will get fixed somehow and things will go back to normal. If those expectations deteriorate, markets will have more to price in.
Sam Burns, CFA
Chief Strategist