Markets globally continue to show strong risk-seeking behavior, a continuation of the broader trend in place for much of the time since late March 2020. That was the point at which monetary and fiscal policy activity surged to produce enormous stimulus in the US and globally.
Recent US legislation that included a total of about $900 billion in new fiscal support is now starting to be felt, and recent political developments have increased the odds of further fiscal support this year. Alongside this persistent fiscal support to counteract the severe economic impacts of COVID-19, monetary policy remains extremely accommodative. Near-zero policy rates and heavy bond buying programs are expected to be maintained for many months if not years, putting both monetary and fiscal policy firmly in the “highly stimulative” category at the same time.
This backdrop has allowed the strong demand for risky assets to continue, as reflected in many measure of market prices. Our chart below shows four such measures: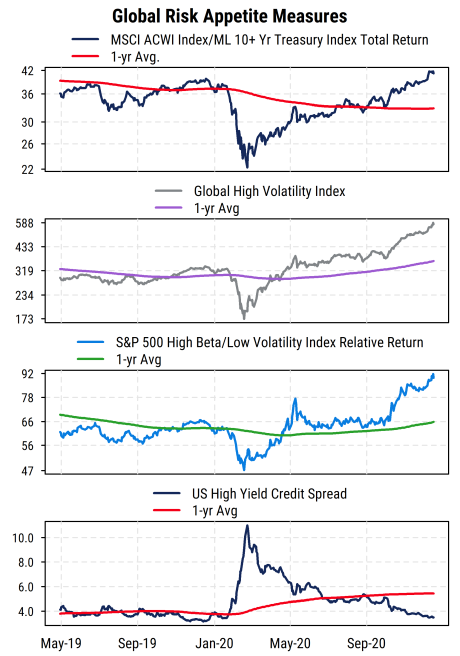
Top section: The MSCI All-Country World Index (ACWI) is a broad global equity index, and it has been outperforming the total returns generated by the ICE/BofA Merrill Lynch (ML) 10+ Year Treasury Index (measuring returns to Treasury bonds with maturities of 10 years or more). This stock/bond relative return series has recently moved above its pre-COVID peak as bond returns have been weak and stock returns have been very strong.
Second section: Here we plot our own custom index of global high volatility stocks (top decile of global stocks above USD$200 million market cap, ranked by trailing two-year historical return volatility). This index of risky stocks is a useful measure of investor risk appetite. It has posted powerful gains since the March low in equity prices, and continues to make new highs.
Third section: This shows the relative returns of the S&P 500 High Beta index versus the S&P 500 Low Volatility index. The High Beta index reflects the 100 stocks in the S&P 500 with the highest market beta (sensitivity to stock market movements) and is a measure of high-risk stock activity among US large-cap stocks. The Low Volatility index captures the 100 stocks in the S&P 500 with the lowest historical return volatility (both indices are rebalanced quarterly). Their relative return is another measure of risk appetite among investors based on the relative riskiness of stocks within the major US benchmark index. It has been rising sharply again after a pause over the summer and is also making new cycle highs.
Fourth section: Turning to debt markets, this plots the average credit spread on high yield (junk) bonds in the US. The credit spread measures the additional yield investors require over and above the yield on a US Treasury bond of the same maturity to hold the debt of a high-risk borrower (i.e., companies with weaker financial conditions and thus higher default risk). That spread surged in the immediate aftermath of the COVID crisis in March/April of last year, and then has been steadily declining thanks to the Fed’s aggressive support of the corporate bond market. Recently it has continued to make new lows (reflecting greater risk appetite among investors), and is now back to pre-COVID levels despite the ongoing economic turbulence.
So we can confidently say that investors are content to take on greater risk than usual with the expectation that government support for markets and the economy will continue. We also note that the volatility of stock prices recently has dropped back down to very low levels, another condition typically found when risk appetite is high and a bullish trend is well established.
Under these conditions, we would normally expect options traders to react to the low market volatility and favorable backdrop by reducing their expectations of short-term future volatility. This would typically be visible in the CBOE VIX index, which measures the expected level of market volatility over the next month embedded in S&P 500 index options prices.
But right now, we see that the VIX has held at relatively high readings, and allowed a wide gap to open up between implied future volatility and recent realized volatility. We can see in the chart below that normally the VIX and realized volatility move together and are closer than they are now.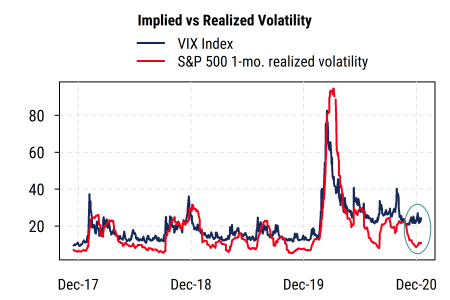
It appears that options traders do not expect the current stability in equity markets to continue, and are pricing in a significant rebound in volatility (which is typically associated with falling stock prices). Our analysis indicates that this tends to be a favorable contrarian sentiment indicator: when options traders are especially nervous about rising volatility (relative to actual volatility), it suggests that some investors remain unconvinced and underinvested, which can support further near-term gains.
So while some measures of market sentiment are clearly pointing to high optimism among investors (a worrisome sign from a contrarian sentiment standpoint), the VIX is currently providing a supportive sentiment reading in our view. With the market’s trend still strong and the policy backdrop supportive, risk assets could continue to rise at least a little while longer.