The US economy keeps surprising to the upside, forcing economists and the Fed to catch up. Commentary from Fed officials has shifted to favoring rate cuts later rather than sooner, meaning policy rates will stay at current high levels a while longer. And while major stock indices have been sensitive to movements in bond yields in the shorter-term (including just recently), stocks have nonetheless continued to outperform bonds and hit record highs as recently as last month.
Strong economy = small-cap outperformance? Not this cycle
And while most stocks are up substantially since the most recent market lows in late October, there remains a persistent trend of large-cap stocks outperforming small-caps. This may come as something of a surprise given that smaller companies are typically viewed as being more sensitive to economic growth, so the surprisingly strong economic growth seems like it should be helping small-caps even more than large-caps.
But this has not been the case, either in terms of stock returns or in terms of relative fundamentals (sales, earnings, etc.). The underperformance of small-caps in the stock market reflects their recent underperformance on corporate fundamentals.
The chart below shows the relative returns of the S&P 500 (large-caps) vs S&P 600 (small-caps) in the top section, along with the rolling next-12-month (NTM) consensus index earnings per share (EPS) for each index in the middle section (both indexed to 100 as of three years ago), and the relative EPS in the bottom section. Since early 2023, the S&P 500 has been outperforming the S&P 600 both on returns and on relative earnings growth. Indeed, the forward EPS for the S&P 600 were well ahead of the S&P 500 in early 2022, but have subsequently declined substantially since mid-2022 (about the time the Fed started raising rates), while EPS for the S&P 500 have been rising for over a year and are at record highs.
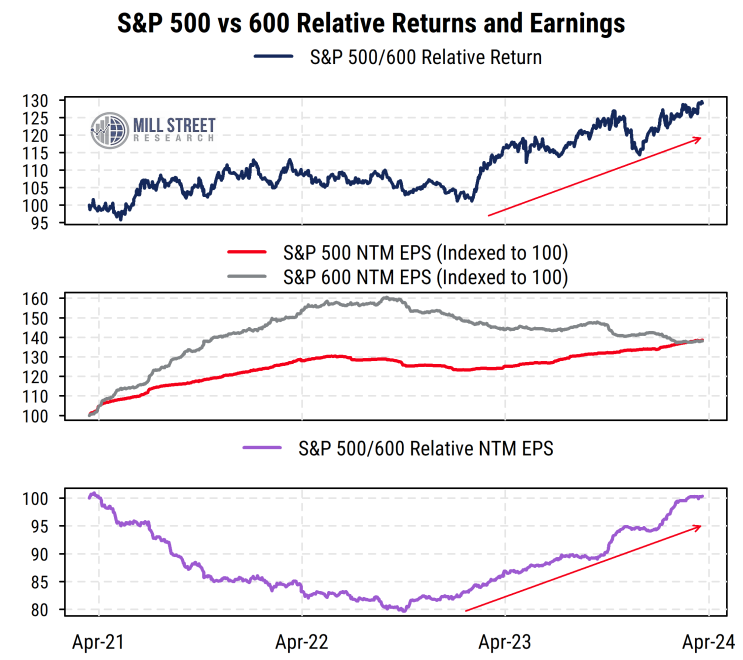
Source: Mill Street Research, Factset
High rates hurt small companies more than large companies
One crucial difference is that the economy is doing well in aggregate despite tight monetary policy, not because of loose policy as in some cases in the past. Indeed, the key assumption that has led many economists, strategists, and investors astray in the last two years is that “higher rates make the economy slow down, full stop”. Higher rates certainly CAN slow the economy, but they do not HAVE to, and the lags between rate hikes and weaker growth can be quite long in some cases (like this one). Other things have offset the headwinds of higher rates, like the large-scale refinancing of debts at low rates in 2020-21, supportive fiscal policy, supply growth (including immigration) and productivity improvements.
The issue for small-cap/large-cap relative performance is that higher rates (tighter policy and lending conditions) have a widely differential effect on large vs small companies. Large companies are, on average, much more profitable than small companies and have better access to capital. So not only do they tend not to need to borrow as much (they can finance growth with retained earnings), when they do they can borrow on better terms.
Banks have tightened standards and rates are much higher
Small companies, particularly newer ones that may not have achieved profitability yet, need cheaper capital a lot more than large companies. So higher interest rates and tighter bank lending standards have a lot more impact on small companies than on large companies. The chart below shows some results from the Fed’s quarterly survey of commercial bank loan officers asking how many have tightened lending standards (requiring more collateral, stronger covenants, charging higher rates, etc.) in the top section. Positive readings mean more banks tightened lending standards than loosened them (note that in the Fed survey, “Large/Medium”-sized firms are those with sales of more than $50M, so it would include most publicly-traded “small-caps”). We can see that since 2022, there has been a persistent majority of banks tightening standards, and that tilt remains in place even if it has eased from its peak recently.
The bottom section of the chart shows the average interest rate on high yield (“junk”) bonds over time. Most smaller companies are not investment grade (rated Baa/BBB or higher by Moody’s/S&P) so have to borrow at higher (junk-bond) rates. Companies that could have borrowed at around 4-5% in 2020-21 have had to pay 8-9% for much of the last two years. Unless the Fed cuts rates, it is unlikely that there will be any meaningful relief on rates for these borrowers.
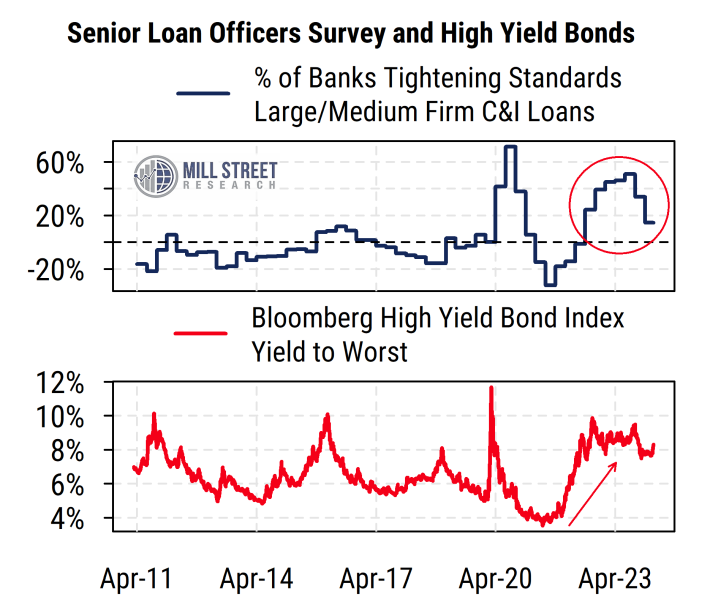
Source: Mill Street Research, Bloomberg, Federal Reserve
Corporate fundamentals reflect size-based differences in rate sensitivity
We can see the impact on corporate fundamentals reflected in the differences in debt levels and interest coverage for the S&P 500 index and the S&P 600 index. The chart below shows the aggregate ratio of total debt to total assets (as a percentage) for each index over time (data from Factset), along with the difference in the ratios between small-caps and large-caps. Not only have large-caps had lower debt levels than small-caps historically, but the gap has widened in recent years. Large-cap debt levels relative to assets have been declining while small-cap debt levels have not and remain quite elevated relative to where they were in the 2010s. Note that the S&P 600 index is typically a “higher quality” small-cap index than the Russell 2000 index, since S&P tends to choose stocks that have at least some positive earnings before adding them to the index. Russell does not have earnings requirements for their index and thus it tends to have more money-losing companies in it than the S&P 600 does.
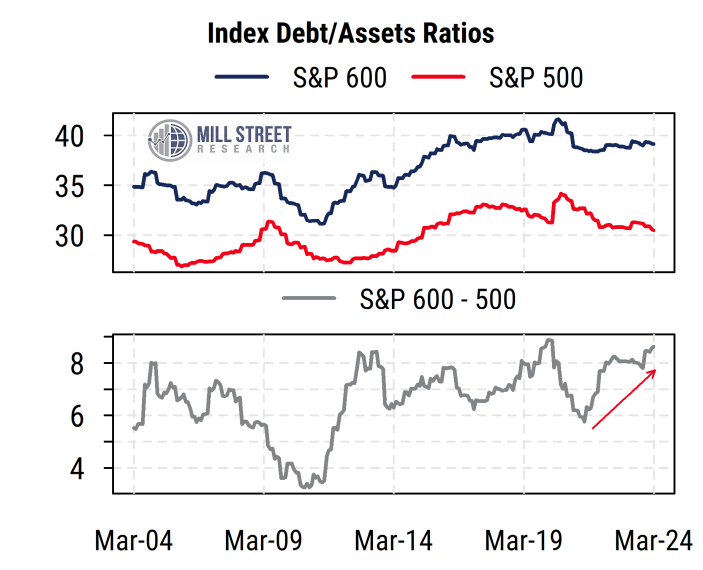
Source: Mill Street Research, Factset
So we can see that small-cap balance sheets (even with S&P’s tilt toward profitable companies) are more levered than those of large-caps, but what about the impact on earnings? The chart below shows an income statement measure to highlight the impact of both higher leverage, higher average financing costs, and higher interest rates over the last two years.
It shows the ratio of operating cash flow (company income excluding effects of financing and investment spending) to annual interest expense for each index. A higher ratio indicates better interest coverage (less risk of default), or a lower impact of debt costs on overall profits.
We can see that the cash flow/interest expense ratio for the S&P 500 has come off its peak but is still quite solid both in absolute terms and relative to historical norms at about 9.5X (i.e., operating income is 9.5X the size of interest expense, or interest expense is equal to about 10.5% of profits).
For the S&P 600, however, the picture looks quite different. Not only do small-caps consistently have much lower interest coverage ratios, but the ratio has been falling for years (well before COVID), and has recently been at its lowest level in at least 20 years around 2.8X. That is, interest expense is equal to roughly 36% of operating income for S&P 600 companies in aggregate.
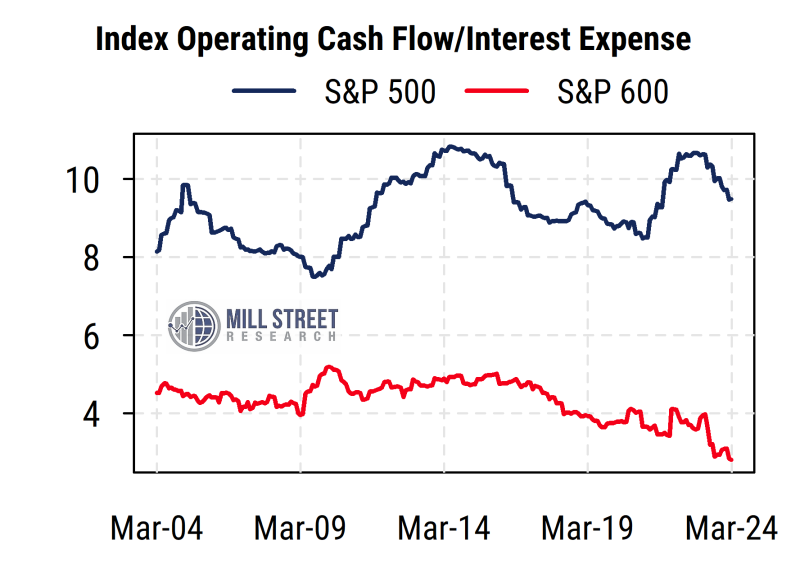
Source: Mill Street Research, Factset
The decline in interest coverage in the last year or so no doubt reflects the sharp rise in interest rates, and the trend will likely continue for a bit longer given that rate increases take time to be reflected in company income statements due to most debt being fixed rate rather than variable rate. Recall also that the Fed did raise rates several times by a total of 200 basis points (2%) in 2017-18, before rapidly cutting during COVID, and then pursuing the current aggressive tightening campaign starting in March 2022.
Higher rates have hurt smaller companies more than large
The big picture, however, is clear: despite continued solid US GDP growth, small-caps are seeing a much more significant impact on their profitability from higher rates, which we see in the aggregate earnings trends. The stock market sees this as well and has continued to favor large-caps over small-caps for much of the last year as the rate impact has grown.
Rates are certainly not the only factor affecting small-cap/large-cap relative performance, but it is likely that small-caps will struggle to outperform until the interest rate backdrop improves. Rate cut expectations in the bond market have corresponded with shorter-term relative performance of small- vs. large-caps, but a more decisive shift will likely have to wait until the Fed does indeed start to cut rates (assuming it is not the result of a big negative economic shock).
We have models to help guide our size allocation decisions using cyclical indicators, and they continue to argue for favoring large-caps, in line with the recent performance trends. Some of the inputs capture the influence of rates, and the recent signs of “higher for longer” in Fed official commentary likely mean that “large-caps for longer” is the result.
Sam Burns, CFA
Chief Strategist