
Low stock correlations and rapidly rotating leadership is making the indices look more stable than the underlying stocks are. Earnings expectations are extremely high but starting to come under more scrutiny. Risk is higher than the VIX makes it look.
The big feature of the US market lately has been the gap between individual stock volatility and index volatility, which is driven by historically low average correlations between returns for individual stocks and sectors. The other feature has been rapid rotation between styles and sectors, mostly between “AI-related” stocks and “the rest of the market”.
Nothing in market forecasting is ever easy, but some conditions make it harder than others. The market backdrop right now has made sector/industry allocation more challenging because, in short, investors are flip-flopping on what sectors they like much more than usual. And while that sounds like it would be part of a “high volatility” market environment, that too is complicated now: the average volatility of stocks and sectors has indeed jumped, but the flip-flopping between sectors happens to be finely balanced enough to keep the overall index (S&P 500) level volatility muted.
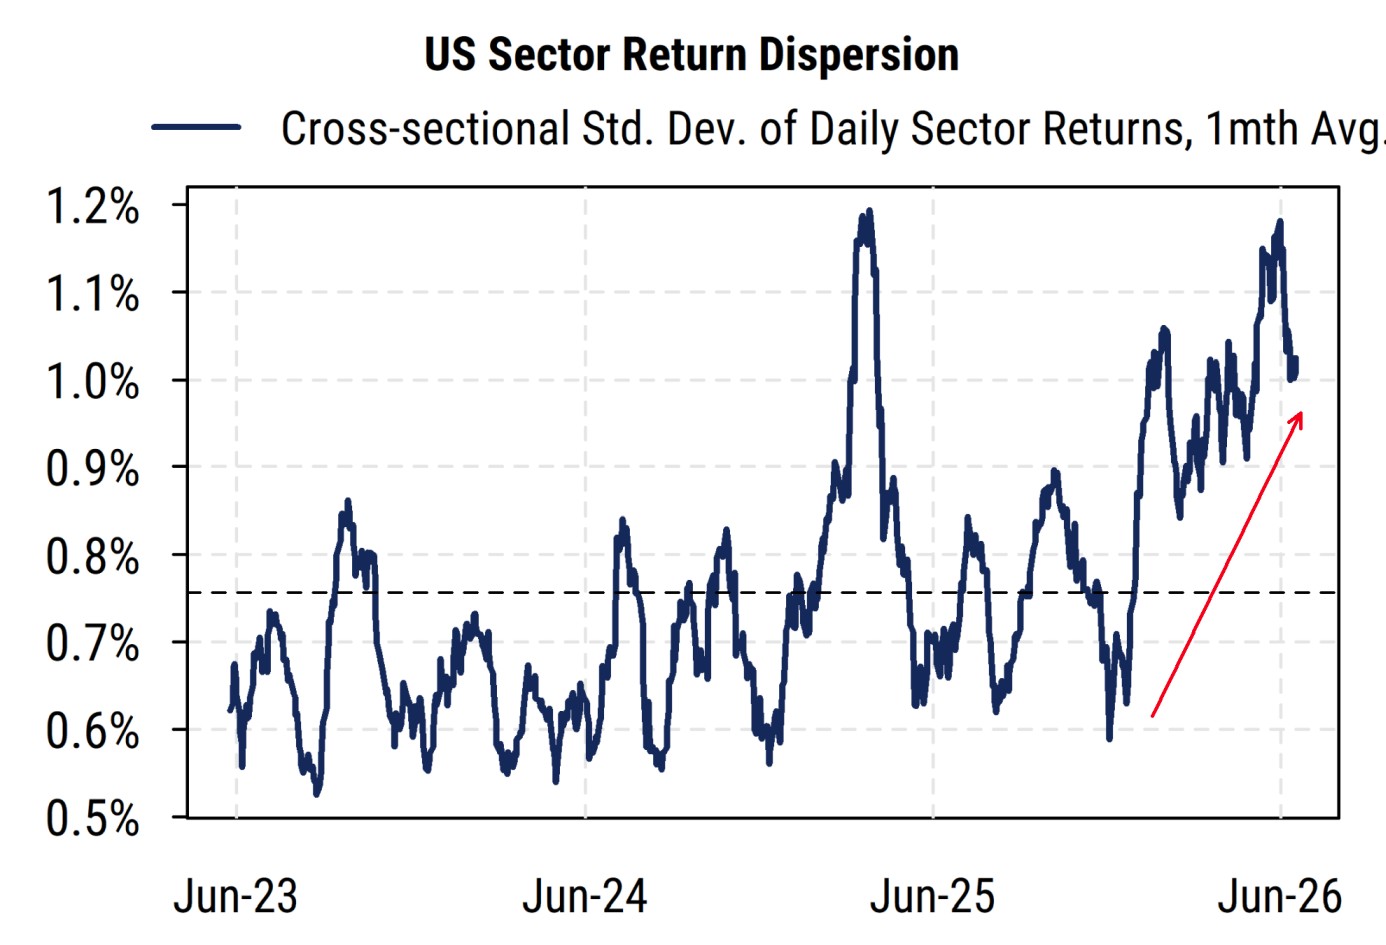
The chart below shows one measure we have tracked for a while: the average dispersion in sector returns for our all-cap, equal-weighted US sector indices (so no mega-cap bias here). It tells us that the typical difference between strong and weak sector returns each day (cross-sectional standard deviation of daily sector returns) has surged in recent months from its average level of around 0.75% to around 1.1% lately. This means relative sector bets have higher variance now on a day-to-day basis: you are more likely to have either a very good day or a very bad day in relative performance terms.
Source: Mill Street Research
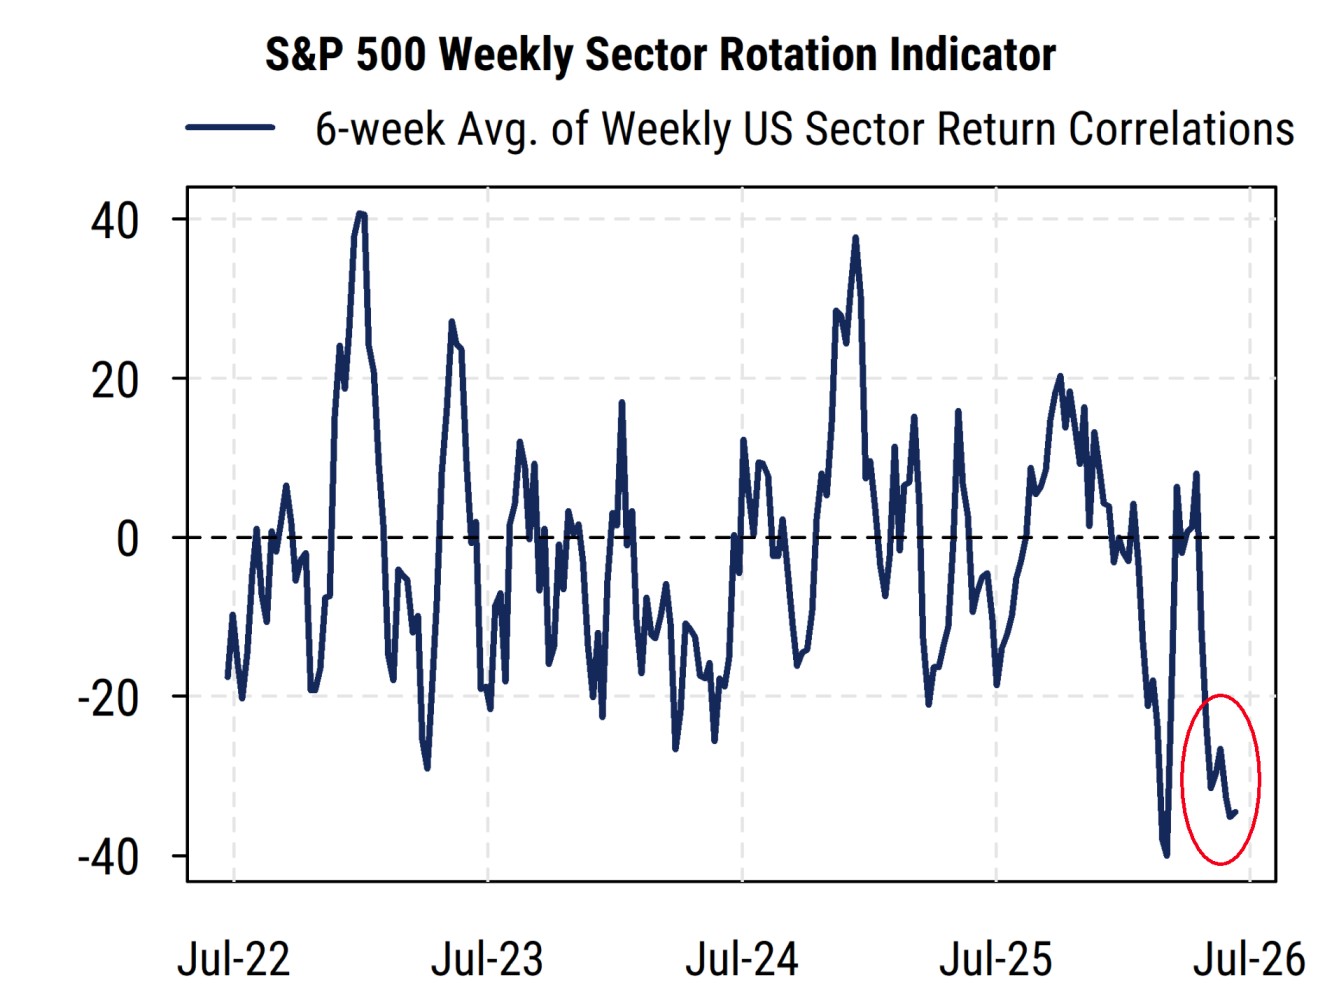
The second chart below shows a different angle: rather than the differences in returns across sectors (dispersion) each day, it shows the how much rotation there has been using the correlation in the rank order of weekly sector returns. So if last week’s winners become this week’s losers more often, the correlation turns negative, while relative return persistence (winners keep winning in the short-term) comes through as a positive correlation.
The recent readings have been especially negative (on a rolling six-week basis), indicating that there are a lot of reversals between winner and loser sectors from week to week. This implies more uncertainty about the future path of the economy and the market, even as investors seem to be staying invested in stocks overall.
Source: Mill Street Research
Diversification holding the indices up lately
Return correlations between stocks has plunged to historic lows, which means that even while most individual stocks are more volatile now, the major indices (like the S&P 500) have shown relatively low volatility. So underlying risk in the market is being “hidden” by the effects of diversification.
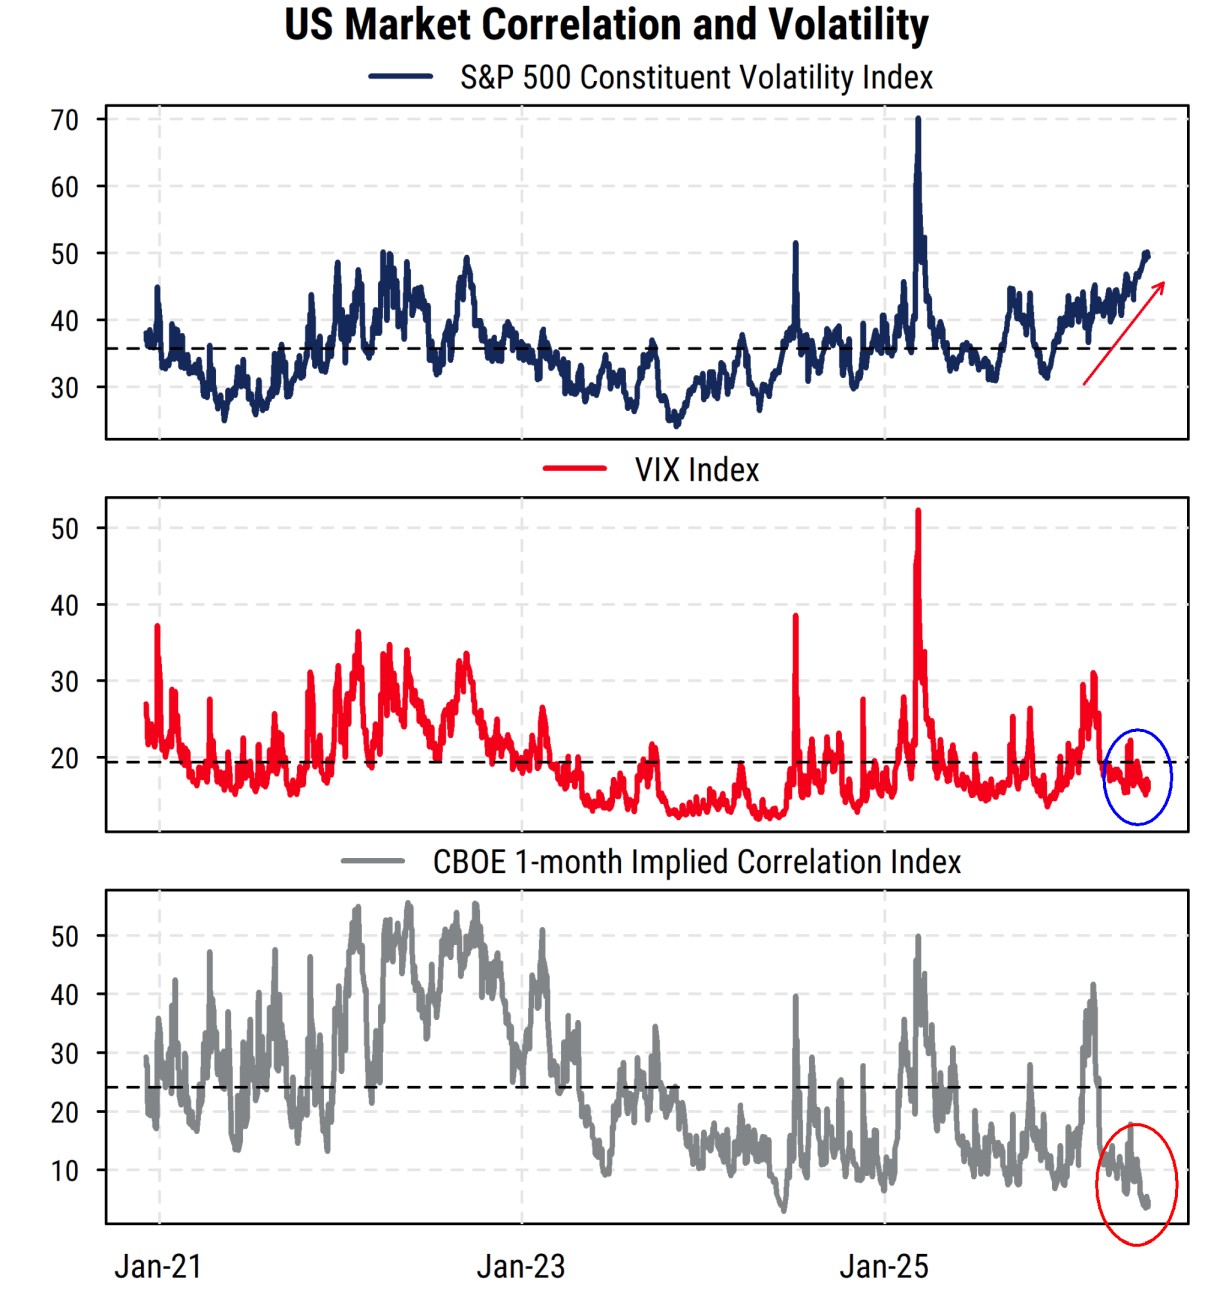
The chart below shows the key metrics. The Constituent Volatility index (from the CBOE) in the top section is an average of the next-month implied volatilities for stocks in the S&P 500 (sort of an average of their individual “VIX” calculations). It is currently near 50% and thus at levels typically seen in bear markets when market-wide volatility is also high. Portfolio managers watching their holdings day to day will feel this intuitively.
Source: Bloomberg, Mill Street Research
But the middle section shows the widely-watched VIX index of S&P 500 index volatility, and it is holding at below-average levels lately. It shows no sign of the bear-market-level volatility that we see in the individual stocks. How can this be?
It is because the only “free lunch” in investing, diversification, is serving up extra portions right now to keep the index from moving too much despite all the movement in the constituents. The Implied Correlation Index of expected correlations among S&P 500 constituent returns is at its lowest level in the CBOE data set since 2006. So high volatility across stocks is delicately balancing out to keep the index stable. But history clearly shows that correlations cannot remain this low over long periods, suggesting either stock volatility has to fall or index volatility will rise.
Strong earnings growth means investors are not leaving the stock market, just moving around more.
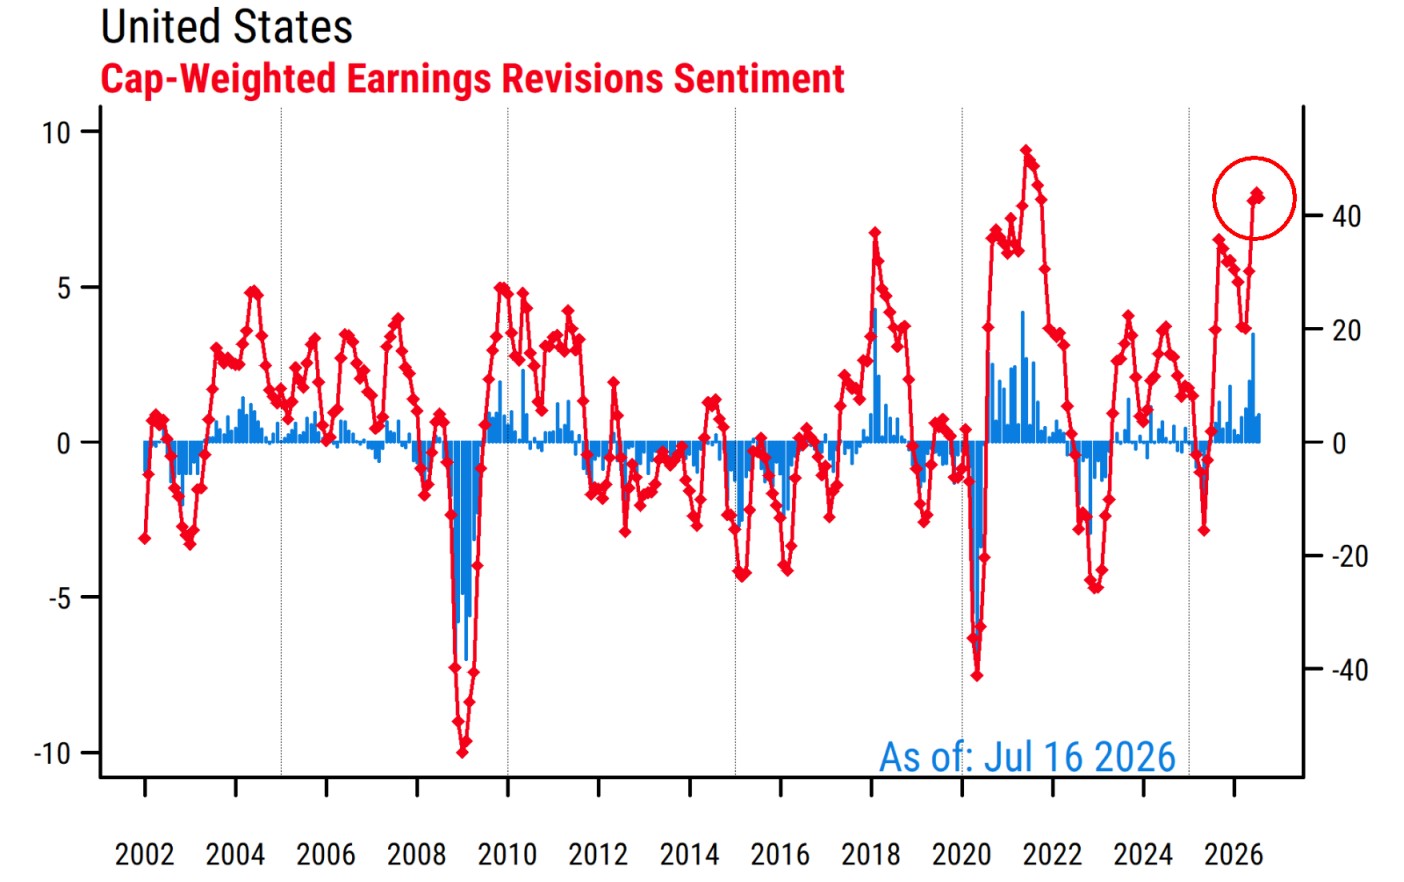
At the same time, earnings estimate revisions are historically strong in the US, particularly for cap-weighted readings. This rarely happens except in the rebound from a recession, and the chart below shows that only the post-COVID rebound (with its massive stimulus support) was slightly stronger in the last 25 years. So analysts are about as bullish on US earnings as they ever are.
Source: Factset, Mill Street Research
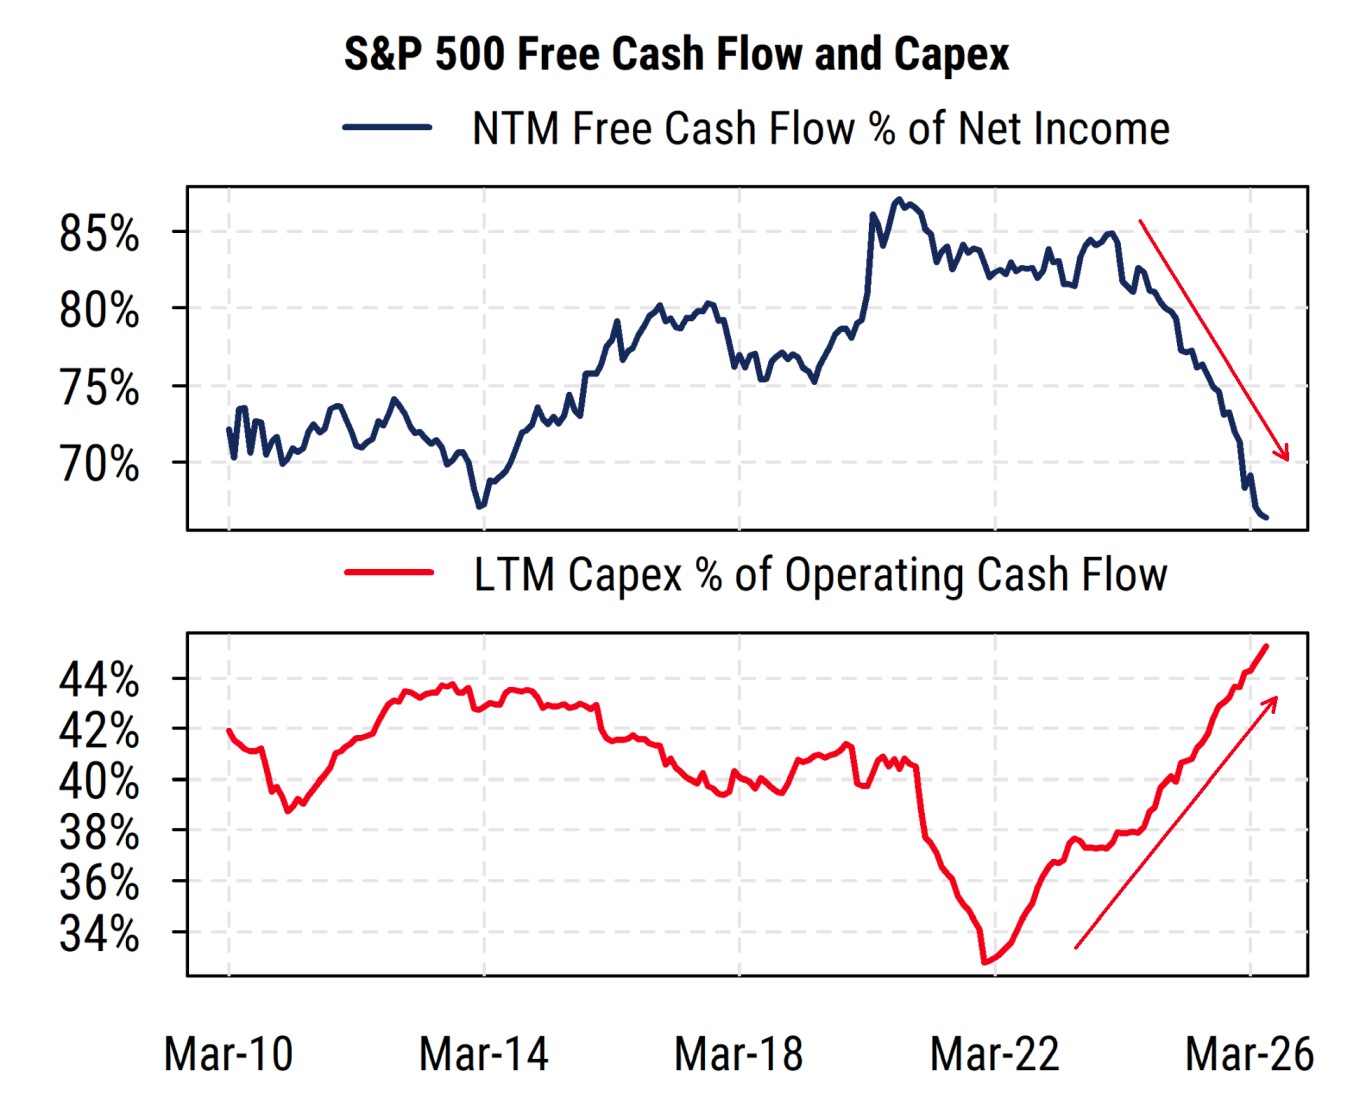
But those earnings are getting more scrutiny, as surging capital spending has widened the gap between expected free cash flow and net income for the S&P 500 (chart below). This is one measure of “earnings quality” that has deteriorated since companies are increasing capital spending faster than depreciation expense, leaving less to distribute to investors via debt paydown, equity buybacks, or dividends.
The risk embedded in the massive bet on Tech/AI-related capex paying off is gradually becoming more salient to investors, which could limit valuation expansion despite the seemingly strong projected EPS growth.
Source: Factset, Mill Street Research
We have seen this recently in the equity market response to what seem like very strong earnings reports from makers of technology hardware like memory. Good news is greeted with selling, presumably with the view that the cyclicality of industries like computer memory, storage, etc. has not gone away because of AI, and shortages will turn to gluts again in a couple of years.
Where to look if you are nervous about AI
The sectors tied to AI continue to be the main drivers of the equity market and investor sentiment. For the cap-weighted S&P 500 sectors, this includes Technology, Communication Services (mostly Alphabet and Meta), Industrials (data center building), and Consumer Discretionary (Amazon and Tesla). The Technology sector is of course the core of the AI trade, especially the hardware industries.
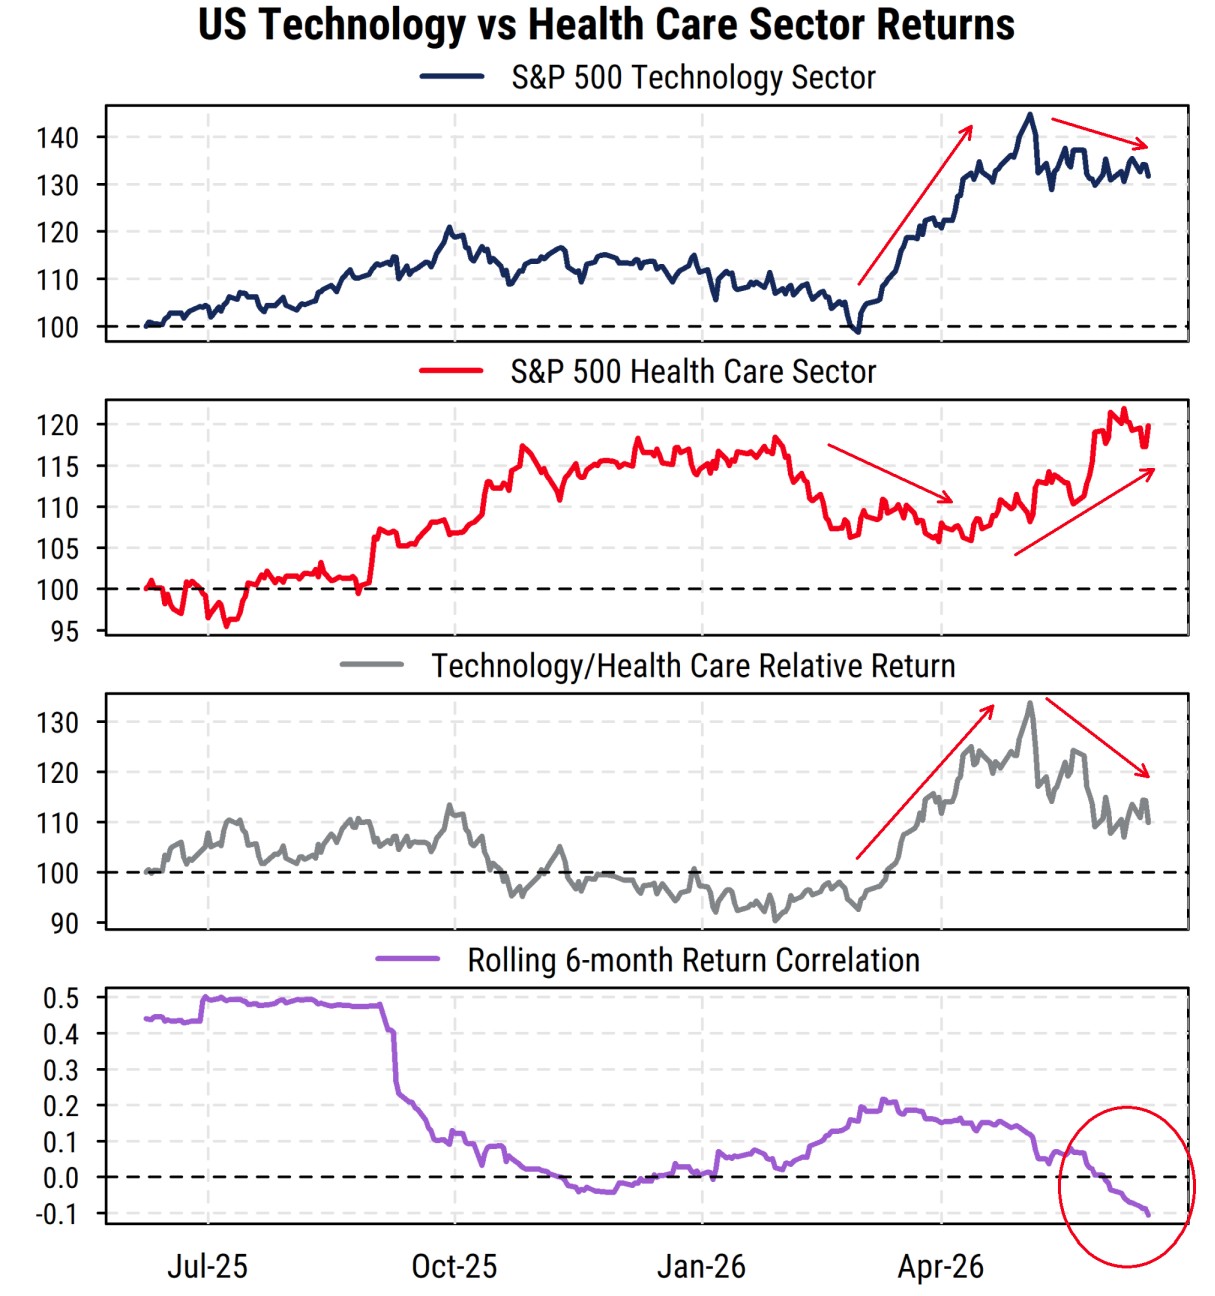
The combined weight of the AI-related areas approaches 50% of the index, so when investors “buy AI, sell the rest” or “sell AI, buy the rest” day-to-day, it ends up almost balancing out for the overall index. But not all of the “rest” of the market performs equally of course. Lately, it has been Health Care and Financials that have tended to lead when Tech/AI has been out of favor.
We can see this in the chart below: Health Care has jumped to new highs lately (red line) while Tech has consolidated (blue line), reducing Tech’s 12-month relative outperformance (grey line). The rolling six-month return correlation between Tech and Health Care fell sharply starting last year and has been getting lower lately, now slightly negative (purple line). So Health Care has been a good hedge relative to Tech.
Source: Bloomberg, Mill Street Research
This is partly because Health Care is still relatively strong on revisions among the non-AI-related sectors, along with Financials and lately Real Estate. But also, Health Care and Financials are the largest non-AI-related sectors and also have low correlations with the S&P 500 index. So if a portfolio manager wants to avoid the AI-related areas in the index, he or she is almost forced to buy the larger sectors in the non-AI category, and likely want a lower-volatility hedge (unlike, say, Energy) that has solid fundamentals (unlike, say, Consumer Staples).
Our US sector allocations have been overweight in Health Care largely for these reasons: it has supportive fundamentals (just not as extremely positive as Tech-related areas), it has moderate valuations and reasonable long-term growth potential, and it has moderate volatility and low correlation with the riskier parts of the market. Financials have somewhat higher market correlation (beta risk) and some secondary AI exposure (private equity/debt) but also have solid revisions. So those would be the better areas to seek non-AI exposure without being fully defensive right now.
Sam Burns, CFA
Chief Strategist