7 April 2022
While all markets have been volatile recently, the normally “safe” Treasury bond market has been especially volatile, and is giving mixed signals. This means that even in a generally “risk off” backdrop, the normally riskier stock market (S&P 500) has outperformed long-term Treasury bonds by a historically wide margin over the last month.
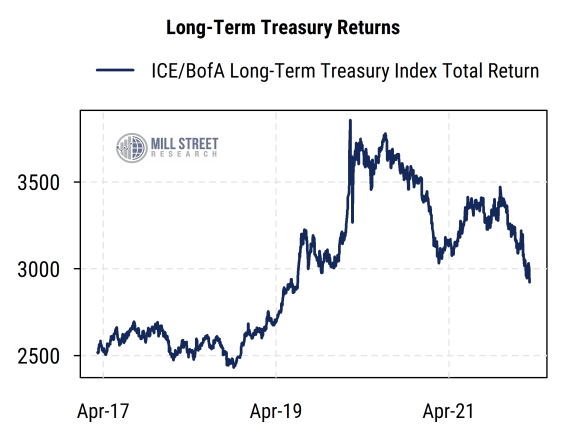
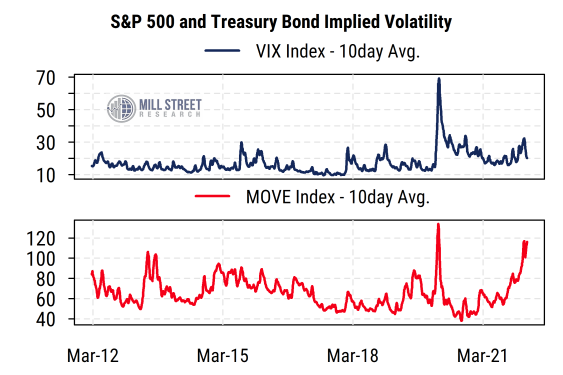
The US bond market has had a rough time lately. The ICE/BofA Long-Term (10 year+) Treasury Total Return index (i.e., which includes coupon payments and price changes) has fallen 16% from its latest November 2021 peak, and is down 23% from its latest cycle peak in July 2020 (excluding the spike in March 2020). Thus bonds are clearly in a bear market by the unscientific “down 20% or more” rule of thumb. And from a volatility standpoint, bonds are at more extreme readings relative to their normal range than stocks are, based on the VIX (S&P 500 implied volatility) and the MOVE index (Treasury bond implied volatility).
 Source: Mill Street Research, Factset, Bloomberg
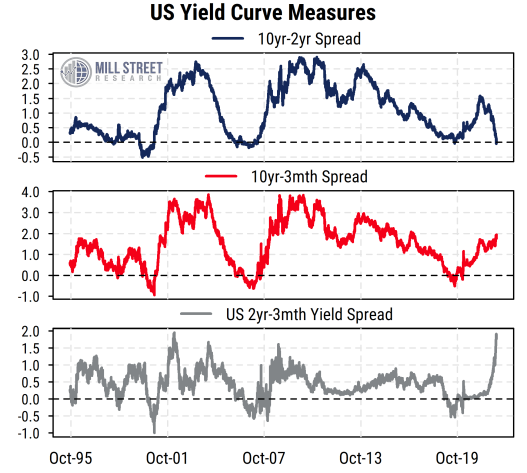
The gyrations in the bond market in response to inflation reports and expected Fed policy have created unusual conditions for the US yield curve. Many headlines have focused on the recent inversion of the traditional 10-year/2-year Treasury yield curve (2-year yields were recently marginally higher than 10-year yields), which is often viewed as a precursor to recessions.
However, as shown in the chart below, other yield spread measures show a very different picture. Using the difference between the 10-year yield and the 3-month T-bill yield (which more closely tracks the Fed funds rate), the yield curve has been steepening and is far from inversion. Such a condition is unusual, as previous cycles have typically seen the 10yr/2yr curve and the 10yr/3m curve flatten together.
This then leads us to the short end of the curve, where we see that the differential between the 2-year and 3-month yields is extremely wide by historical standards (nearly 2%). Such a wide spread here reflects the market’s expectations for aggressive Fed rate hikes in the next year or two (200 basis points or more), driven by high reported inflation rates that have made the Fed look like they are “behind the curve”. Investors, so far, believe the Fed will raise rates to around 2.5%-3.0% and then stop, and possibly then have to cut rates as the economy slows in the longer-term. Given where inflation is now, this implies real rates will mostly remain negative for some time, and the Fed will not tighten as much as it has in some previous cycles.
 Source: Mill Street Research, Factset
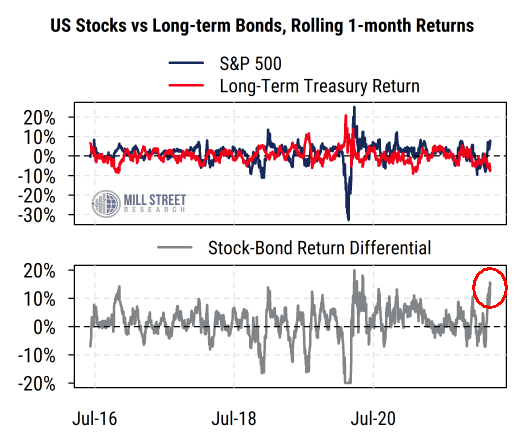
Perhaps the most surprising thing in some respects is how the US stock market has behaved as bond yields have surged. Normally rising rates are a threat to stock prices, and stocks did indeed correct substantially in the first two months of this year. But stocks have recovered recently even as bond prices have not, which has created a historically wide gap in stock-bond performance over the last month.
As shown in the chart below, the rolling one-month difference in returns for stocks (S&P 500) and bonds (long-term US Treasuries) recently touched 15%. This is an extreme spread, exceeded recently only in the immediate aftermath of COVID in 2020 (where we saw extremes in both directions).
 Source: Mill Street Research, Factset
In our view, this dramatic outperformance of stocks over bonds even in what is otherwise more of a “risk off” market backdrop reflects the Fed’s recent policy change toward allowing more inflation before tightening, along with the unusual nature of both COVID supply chain disruptions and the war in Ukraine. Real interest rates remain low (negative by many measures) even after the backup in bond yields, so monetary conditions are in the process of tightening but are still far from being tight. Inflation is worse for bonds than stocks in principle because inflation flows through to corporate earnings while interest payments are fixed. Stocks have historically been hurt less by inflation itself than by the Fed’s response, often involving tightening monetary policy to the point of causing a recession. If investors think the Fed will avoid going that far in this cycle, then earnings and thus stock prices may consolidate in a wide, volatile range but not suffer a severe bear market (possibly similar to the 1994 scenario).
Overall, we have favored stocks over bonds even as we expect stocks to remain volatile for a while longer. Both stocks and bonds are down for the year-to-date, though that follows a very strong year for stocks in 2021 (bonds did not do well in calendar 2021). Rates and macro uncertainty will likely keep a ceiling on stock prices, while rising earnings and a presumption the Fed will not overtighten will help keep a floor under them. The rest depends largely on fiscal policy and geopolitical developments.