16 June 2022
Last month we commented that while the CPI readings remain very high, there are signs of moderation in commodity prices. With commodity prices remaining center stage as a macro driver, we continue to closely watch the various commodity indices, including the S&P GSCI index and its subcomponents.
There now seems to be a greater divergence between energy prices and other commodities.
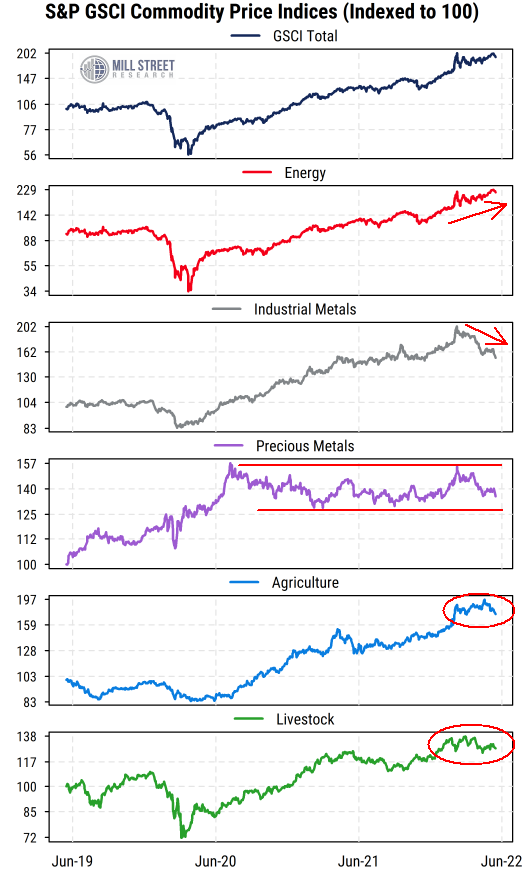
The chart below shows the S&P GSCI Commodity Index (top section) along with its component indices over the last three years.
 Source: Mill Street Research, Factset
Energy (second section) has continued to make new cycle highs, supported by oil, gasoline, and natural gas. Energy has the most weight (around 54%) in the overall S&P GSCI commodity index, so the trend in energy prices is keeping the headline index in an uptrend.
However, other areas are showing signs of consolidation or pullbacks following last year’s gains. Industrial metals (copper, aluminum, zinc, nickel, etc., third section) have pulled back notably from their highs, and are now actually slightly lower than they were at the start of the year. This may reflect reduced demand from China, which has weakened sharply amid COVID lockdowns.
Precious metals (fourth section) are less important to overall inflation but are often perceived as an inflation hedge. The prices for gold and silver have been largely range-bound for most of the last two years, peaking in mid-2020. They too have pulled back recently as the dollar has strengthened and investors look elsewhere for inflation hedges.
Food prices are a key concern globally, and are up sharply from their levels of two years ago. But most recently, both the Agriculture index (wheat, corn, soybeans) and the Livestock index (hogs, cattle) have stabilized in recent months and are now off their peaks (fifth and sixth sections).
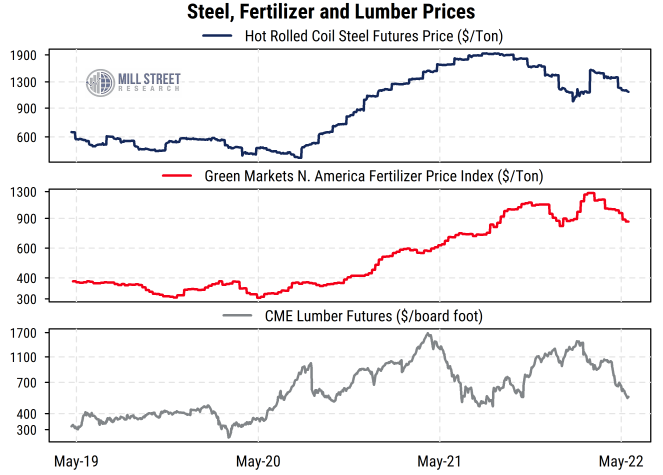
Other key commodities like steel (for cars, etc.), fertilizer (for crops), and lumber (for houses) are still very high relative to historical norms, but have also pulled back substantially from their highs recently, as shown in the chart below.
 Source: Mill Street Research, Bloomberg
Tighter policy and slowing demand should bring inflation down within a year or two.
These consolidations or pullbacks in non-energy commodity prices could be just pauses in ongoing uptrends, but signs of slower growth globally (and especially in China) alongside tighter monetary and fiscal policies suggest that the demand side of the equation is easing. Supply remains a key concern, especially for any commodity tied to Russia or Ukraine, but much of that news may be priced in by now.
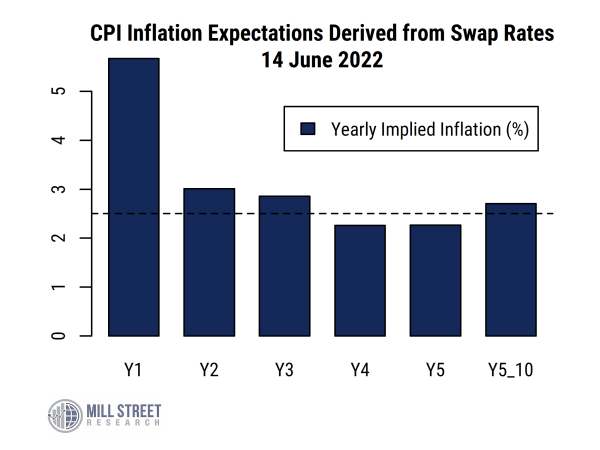
And the latest readings from the markets that allow investors to bet directly on future inflation (inflation swaps) show that the market expects inflation to cool quickly within a year or so. As shown in the chart below, investors expect inflation to average over 5% in the next 12 months, but then drop to 3% or less by late 2023 and remain near there over the longer-term.
 Source: Mill Street Research, Bloomberg
Inflation is indeed a problem right now, but current policy actions and the natural slowing of global growth will likely bring it down substantially over the next year or two, making it unlikely that we see a 1970’s-style inflation trend that lasts for many years.