4 August 2022
One of the asset allocation decisions we research is whether to favor large-caps or small-caps within an equity portfolio. Currently, we see a stark divergence in the broad categories of indicators: the fundamentals of earnings estimates and valuations are now more favorable for small-caps, while low risk appetite among investors and later cycle economic conditions have been favoring large-caps.
Later-cycle conditions typically argue for large-caps
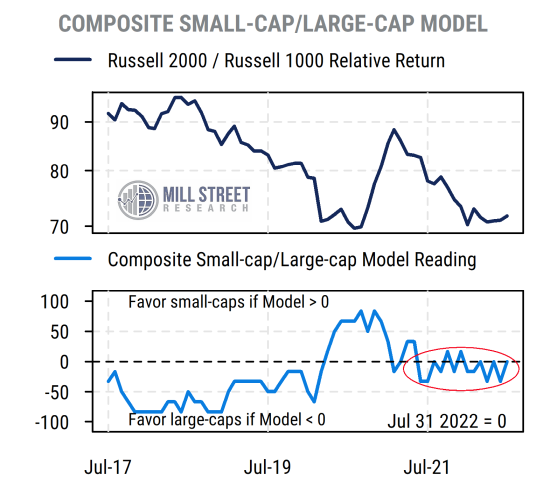
Our primary timing model for small- vs large-cap (size) allocation (proxied by the benchmark Russell 2000 index of small-caps and the Russell 1000 index of large-caps) is based on cyclical economic and market indicators that help gauge whether we are currently in an “early cycle” phase or a “later cycle” phase.
Early cycle conditions, when the markets and economy have been very weak and are just starting to recover (often with help from government stimulus) tend to be best for small-cap relative performance. Once conditions have shifted to mid-cycle or later-cycle, large-caps tend to do better, particularly after accounting for the higher risk inherent in small-caps.
Our multi-factor model that guides our size allocation (shown below) has been tilted toward large-caps for most of the last year, though it has been a very unusual cycle thanks to COVID and the responses to it. Broadly speaking, the model has focused on high corporate earnings growth rates, a wider differential between stock earnings yields and bond yields, rising short-term interest rates, and higher equity market volatility as indicators of mid- or later-cycle conditions that have historically favored large-caps over small-caps.
 Source: Mill Street Research, Factset
The offsetting indicators in the model capture the fact that consumer confidence never reached the high levels typical of later-cycle conditions, and the equity market (along with corporate credit spreads) has already corrected substantially and thus is no longer anywhere near peak levels.
So while the weight of the cyclical evidence remains somewhat tilted toward large-caps, it is a mixed picture at this point. If we stop the analysis here, we would say “if in doubt, stay with the lower-risk choice”, which would be large-caps.
Fundamentals telling a different story
In addition to “top down” cyclical indicators, we also construct “bottom up” measures of fundamental measures of earnings momentum (based on aggregation of analyst earnings estimate revisions activity in individual stocks within an index) and valuations. While we do this in a number of ways, perhaps the most straightforward is to compare the earnings and valuation indicators for the benchmark Russell 2000 (small-cap) index to the S&P 500 (large-cap) index.
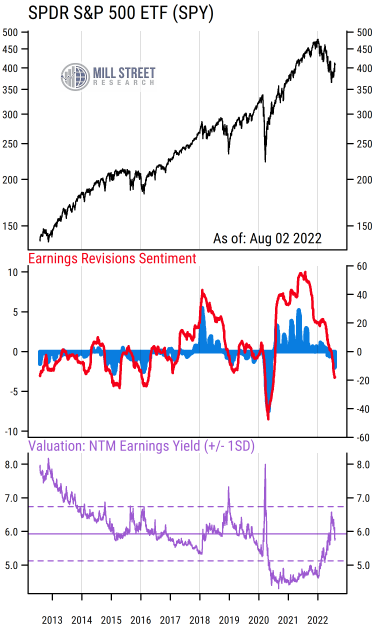
The charts below show our indicators for the indices separately, and then on a relative basis (small-caps vs large-caps). In each chart, the top section shows the price return of the index ETF that tracks each benchmark, or the relative return (a rising relative return indicates small-caps outperforming large-caps, and vice versa).
 Source: Mill Street Research, Factset
The middle section of the charts shows our measures of earnings revisions sentiment. If more analysts are raising their earnings forecasts than are lowering them on average across the stocks in the indices (the indices, and these metrics, are cap-weighted, giving more weight to larger companies), then the red line and blue bars will be above zero, while negative readings indicate more estimate cuts than raises. Thus these indicators are not tracking the actual or forecasted level of earnings, but the direction of the most recent changes to earnings estimates. Higher readings indicate more favorable fundamental tailwinds.
We can see that for the S&P 500, revisions activity has dropped off sharply recently, reversing the extended period of very strong revisions from mid-2020 through early 2022. Revisions being negative is not unusual historically, and much of the 2012-2017 period had negative revisions but still generally rising stock prices, mostly due to valuation changes and the underlying rise in the level of earnings.
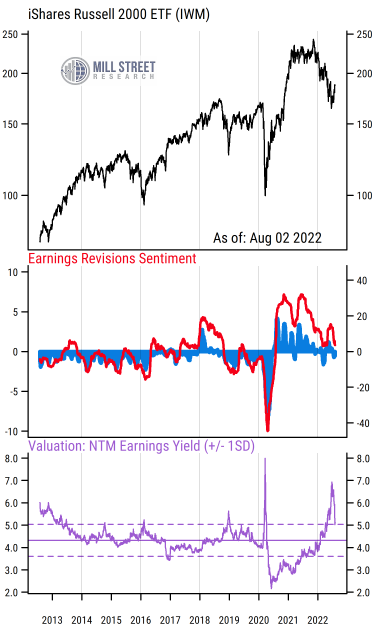
Revisions activity for the Russell 2000 had also been quite positive for much of the last two years, but to a lesser degree than for the S&P 500. And while small-cap revisions have weakened recently too, they have fallen much less, and remain net positive (or close to it).
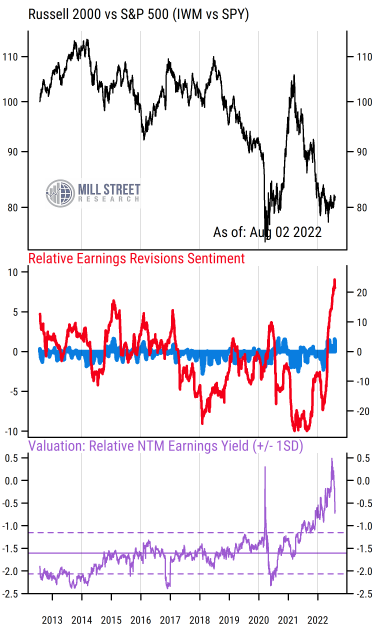
When we look at the chart showing relative performance, we can see very clearly that small-cap earnings revisions have shifted dramatically from very negative relative readings (red line well below zero for much of the last two years) to historically positive readings. This captures the fact that estimate revisions activity has weakened much more sharply for large-caps than for small-caps lately, giving small-caps a stronger relative position now than they have had in at least 10 years.
The final piece is the valuation backdrop. The purple lines in the bottom section of the charts show the forward (next-12-month, or NTM) earnings yield for each index, and the relative earnings yield between the two (the yield on small-caps minus the yield on large-caps).
The Russell 2000 has almost always had a lower earnings yield (equivalent to a higher P/E ratio) than the S&P 500 over the last decade or more. Recently, however, the expected earnings yield on the Russell 2000 has risen much more than that of the S&P 500, briefly giving it a higher earnings yield before its latest pullback. Even now, however, the earnings yield differential is still strongly in favor of small-caps relative to the range of the last 10 years. That is, small-caps look cheap relative to large-caps, which makes some sense given the stark underperformance of small-caps since early 2021.
Fundamentals might favor small-caps, but investors don’t like volatility
Finally, a key driver of small/large-cap relative performance is the fact that small-caps are riskier (more volatile) than large-caps on average, so owning small-caps requires investors to be willing to take on a certain amount of additional risk in their equity portfolios. For much of this year, the signs of tightening monetary and fiscal policy, high inflation, weakness in China, ongoing COVID impacts, and the war in Ukraine have all dampened investor risk appetite. This has not only pushed stock prices in general down, but has caused small-caps to underperform large-caps.
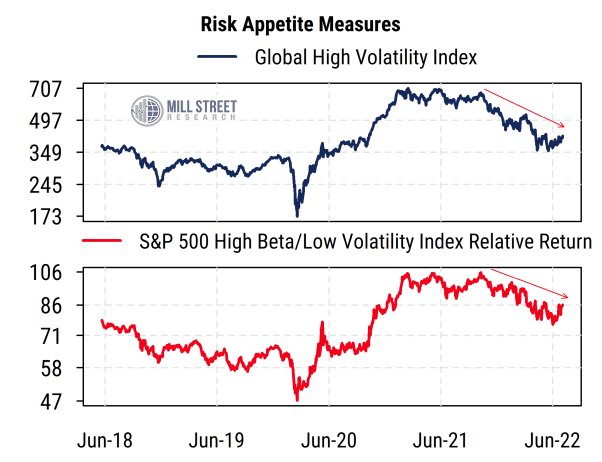 Source: Mill Street Research, Factset
For a while, small-caps also labored under weaker fundamentals (revisions and valuations), but now those conditions have shifted. But even with a better fundamental backdrop for small-caps, if investors are avoiding risk due to the uncertain macro backdrop, then small-caps will struggle to outperform. The last few weeks have seen some signs of improving risk appetite in equities, along with a mild recovery in small-cap relative performance. If risk appetite were to continue to improve, then we might expect better relative performance from small-caps. If not, though, small-cap relative performance might only manage to tread water within a range.
Risk appetite improving somewhat but still muted, waiting for more clarity on policy
Our broader measures of equity risk remain unfavorable on balance, but have been improving recently. And our (more complicated) equity factor analysis shows that after accounting for differences in volatility (and other factors), smaller companies have in fact been outperforming recently. But that analysis also shows that investors still prefer lower-volatility stocks in general, so only small-cap stocks which have lower volatility (of which there are fewer) would find favor at the intersection of these trends right now.
We have favored large-caps over small-caps in our work since September, but the indicators are becoming more mixed now and might argue for a more balanced view soon. Much depends on the Federal Reserve and how investor risk appetite evolves – stocks have likely priced in weak growth or even a mild recession, but further weakness driven by overly tight policy could provoke further weakness, to the detriment of small-caps. A less aggressive policy stance would likely reduce such concerns and give risk appetite a further boost.