4 August 2021
Equity market volatility has been declining this year and has recently been below the long-run average. However, under the surface of the calm at the major index level, style rotation between Growth and Value has been extremely high.
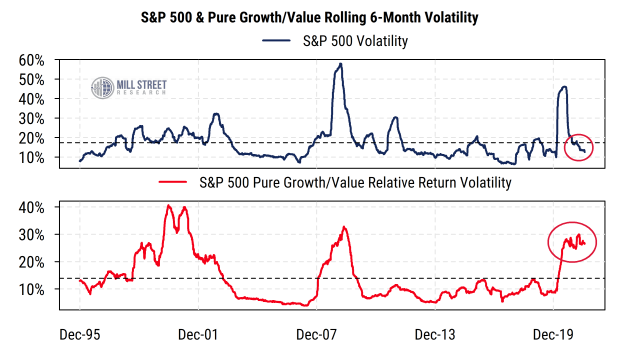
The first chart below plots two rolling volatility series: the top section is the six-month annualized volatility of the S&P 500 index, while the bottom section is the volatility of the daily difference between the S&P 500 Pure Growth and Pure Value index returns. The dashed horizontal lines indicate the long-run average for each series.
 Source: Mill Street Research, Factset, Bloomberg
The volatility of Growth/Value relative returns remains extremely elevated compared to historical norms, recently rivaling the prior peaks in the 2008-09 period and 2000-01 period. Notably, the current rolling six-month readings overlap with a steady, low-volatility advance in the overall US equity market.
High volatility in Growth/Value style performance is likely causing headaches for some active equity portfolio managers, as most cannot switch between styles quickly (if at all), and thus must endure alternating shorter-term bouts of beating or lagging the overall market. And investors being whipsawed by heavy style volatility within portfolios may be one reason there is still just enough nervousness to prevent investors from becoming so excessively optimistic that it becomes a market headwind from a contrarian sentiment standpoint.
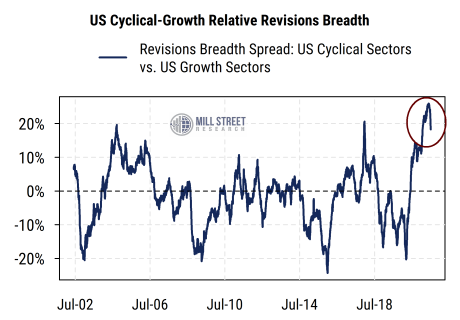
If relative returns are more volatile than usual, what about relative fundamentals? Our aggregated sector earnings estimate revisions data (chart below) comparing cyclical (Value-oriented) sectors1 with Growth sectors2 continues to show a historically strong bias toward Value-oriented sectors relative to Growth. That is, analysts are raising estimates within cyclical/Value sectors more broadly than they are within Growth sectors, and have been for some time now.
However, the latest readings are down somewhat from the recent historic peak. Perhaps this recent behavior in revisions has increased debate about whether “this is as good as it gets for Value fundamentals” (i.e., time to buy Growth), or “Value lagged for a long time and still has powerful fundamental tailwinds, stay with the Value trend”.
 Source: Mill Street Research, Factset, Bloomberg
Our current view continues to support a tilt toward Value/Cyclical sectors, but with the knowledge that heavy rotation makes it a bumpy ride.