22 June 2022
After nearly a decade of US equities mostly outperforming those in Europe, our indicators are finally more decisively aligned in favor of Europe now.
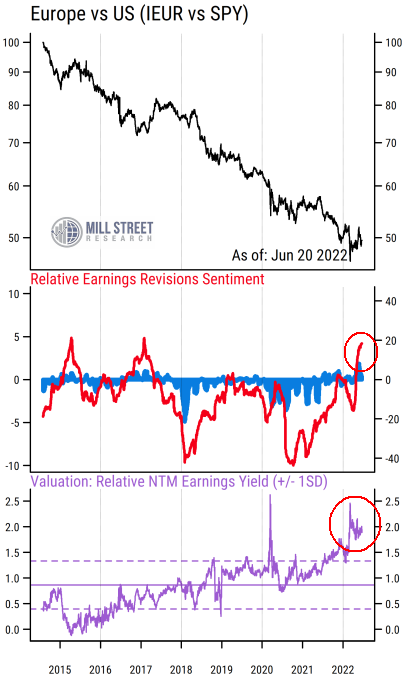
Fundamental momentum has shifted to Europe now
All of the indicators in the chart below are based on bottom-up aggregations of the constituents of the iShares Core MSCI Europe ETF (ticker IEUR) and the SPDR S&P 500 Trust (ticker SPY). The middle section of the chart shows our key metrics of “fundamental momentum” for Europe relative to the US.
 Source: Mill Street Research, Factset
The red line is the key measure, which tracks the net proportion of equity analysts who are raising earnings estimates versus those lowering estimates on a rolling 3-month basis (which we refer to as “revisions breadth”). This is done by constructing a capitalization-weighted average of net estimate revisions for each stock in the index (ETF), and plotting the difference between the aggregated readings for Europe and those of the US.
So when the red line is above zero, it indicates that analysts are raising estimates more in Europe than they are in the US, while readings below zero indicate that US stocks are getting more net positive estimate revisions than those in Europe. The blue bars are constructed similarly, but capture the weighted average month-on-month percent change in consensus estimates for each region, which tend to move along with the revisions breadth readings but can be more volatile.
We can clearly see that for much of the last eight years shown in the chart (since the IEUR began trading in mid-2014), the red line has been below zero, meaning that European stocks have had weaker earnings revisions than US stocks. Not surprisingly, relative returns (shown in the top section, black line) show European stocks have underperformed US stocks persistently over this period (in US dollar terms).
Most recently, however, the relative revisions have shifted in favor of Europe over the US. The red line is now decisively above zero, indicating European earnings estimates having stronger momentum than those in the US. Only twice before since 2014 has the relative revisions reading reached similar levels (early 2015, and early 2017), and in both cases European stocks outperformed the US for a little while. But the fundamental momentum in both of those earlier cases switched back to the US fairly quickly, offering only a few months of European outperformance. Will the fundamentals stay in Europe’s favor longer this time? It is certainly possible, but we will continue tracking the indicators to find out.
Valuations strongly favor Europe now
Relative revisions are one piece of the puzzle, but relative valuations are also important for longer-term relative performance and risk evaluation. Valuations give us an idea of what has been “priced in” by investors, and right now the relative valuations are strongly in favor of Europe.
We measure relative valuation here by using the difference in the forward earnings yields of the two regions. That is, for each stock in the index, we divide the consensus analyst estimate for earnings per share (EPS) over the next 12 months (NTM) by the current stock price to calculate the forward earnings yield (i.e., the inverse of the traditional Price/Earnings ratio). We then construct a capitalization-weighted average of all the constituent earnings yields to get the aggregate for each regional index. Using earnings yields avoids issues which can occur when some stocks have negative earnings.
The purple line in the chart’s bottom section shows the difference between Europe’s earnings yield and that of the US at each point in time. The solid horizontal line indicates the long-run average difference, which is currently about 1.1% (i.e,. European earnings yields have been 1.1% higher than US earnings yields on average since 2014). The dashed lines indicate +/- 1 standard deviation away from the long-run average to indicate the “normal” range of the readings historically.
Right now, the earnings yield difference is close to 2% (i.e., ~8.5% earnings yield for Europe vs about ~6.5% for the US), which is much higher than normal and near the highest reading since 2014 (except for the spikes in early 2020 and early 2022). This means that while European stocks tend to be cheaper than US stocks normally, they are unusually cheap compared to US stocks right now. Such readings imply that investors have exceptionally low expectations for future earnings growth in Europe relative to their expectations for the US.
Low relative expectations + better fundamental momentum = a bullish backdrop for European relative performance
Since 2014, we have not seen this combination of relative estimate revisions and relative valuations in Europe’s favor versus the US. The earlier cases of pro-Europe revisions were not accompanied by favorable relative valuations, meaning that as soon as the earnings momentum started to shift, relative performance quickly went with it. With relative valuations implying a high degree of pessimism toward Europe, there is less risk that the more favorable earnings news is already priced in, or vulnerable to quick reversal at the first sign of a shift.
Europe clearly faces many headwinds right now, with energy prices and the war in Ukraine being at the top of the list, along with the ongoing issues related to Brexit, concerns about peripheral European debt, and others. The US arguably has other concerns, including the potential for monetary and fiscal policy tightening to go too far and push the US into recession (policy makers in Europe have so far been much more cautious about tightening). With investors seemingly expecting little in the way of good news from Europe, the recent signs of stronger analyst estimate activity there may signal an opportunity for relative outperformance in regional equity portfolios.