17 February 2022
Our intermediate-term (3-6 month) indicators have deteriorated enough recently to argue for shifting from overweight equities in our asset allocation framework to neutral. While stocks are still favored over bonds on a longer-term relative valuation basis, the prospect for further consolidation and volatility means that easing back equity exposure and holding somewhat more cash makes sense in our view.
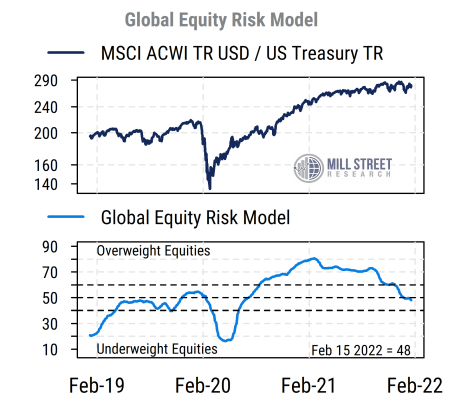
The primary guide for our market risk assessment is our Global Equity Risk Model. It is a composite of eight constituent indicators that capture both equity market and cross-asset (fixed income and commodity) trends to forecast the risk and return prospects over the next 3-6 months. The chart below shows the recent model readings in the bottom section, and with the relative performance of global stocks (the MSCI ACWI index) and bonds (a broad US Treasury index) in the top section.
The model uses a percentile scale (0-100), and model readings above 60% are the most bullish for equities, while readings below 40% are most bearish. The model was decisively bullish on equities (and thus we were overweight equities) and risk assets more generally from September 2020 until December 2021, and has since moved lower and is now slightly below 50% and thus near its neutral level.
 Source: Mill Street Research
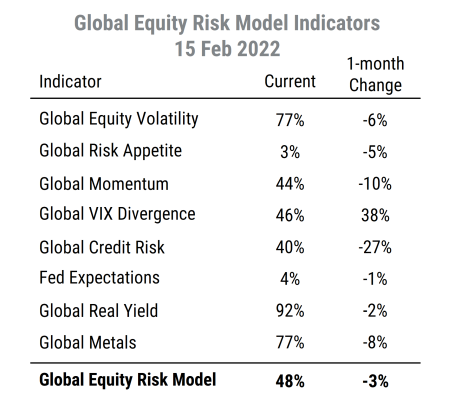
The table below shows the eight component indicators and their current percentile scores. For all indicators, higher readings are more bullish (100% is best, 0% is worst).
 Source: Mill Street Research
The biggest sources of weakness in our model have been the drop in risk appetite (equity and debt), price momentum, and growing expectations of Fed policy tightening:
- Fading risk appetite is visible in the sustained downtrend in high-volatility stocks as a group,
- We now see more signs of a rise in credit spreads on corporate debt from recent very low levels, pushing our Global Credit Risk indicator down sharply in recent weeks.
- Intermediate-term momentum in global equity indices has continued to weaken, with the MSCI ACWI index still stuck in the broad range it has been in since the summer.
- Two-year Treasury yields have jumped even further recently as investors increase bets that the Fed will raise rates faster and also reduce its balance sheet more quickly than previously thought.
The backdrop of relatively low real bond yields and solid economic growth remain generally intact even if off their best readings, and equity volatility is still moderate by historical standards. Thus we do not see evidence to support underweighting equities, but the earlier strong tailwinds for stocks have clearly faded.
We continue to view stocks as more favorably valued than bonds, even after the recent rise in bond yields. Expected real returns on bonds remain negative, meaning that even if stocks are expensive relative to long-term historical norms, bonds are even more expensive. Consequently, we would prefer to shift funds from equities into cash (safe short-term debt) rather than longer-term bonds.
And indeed, for the year-to-date, even with the recent pullback in equity prices stocks (S&P 500) have outperformed long-term Treasury bonds, and high-beta stocks have outperformed low-volatility stocks. Thus the backdrop is clearly not fully “risk off”, just substantially less “risk on” than it had been.