28 February 2023
A bit of history
Mill Street Research was founded around this time seven years ago, and the MAER stock selection model has been the anchor for Mill Street’s “bottom up” quantitative stock selection analysis since then. The MAER name is an acronym for the product’s original name, the Monitor of Analysts Earnings Revisions.
But the MAER model as it stands today actually goes back a bit further. Having been introduced to the original version of the MAER product when I worked at Brown Brothers Harriman (BBH, where the original product dated back to the early 1990s), in early 2012 I was tasked with overhauling it to make it more modern, efficient, and quantitatively robust.
Unfortunately, a restructuring at BBH in mid-2012 shut down the equity research and sales groups, so I continued the development work I had started on MAER after leaving, and then several ex-BBH colleagues and I brought both my new version of MAER and my asset allocation work to Oppenheimer & Co. in early 2013 as the Portfolio Strategy team (before I left after another restructuring to start Mill Street Research in early 2016).
So early 2013 is when the version of MAER in use today was originally launched, and the structure of the model has remained the same ever since. That is, the construction of the model’s six component ranking indicators and their weights have been fixed since early 2013, and all the original testing was done on data from about 2002 to 2012. A brief summary of the indicators and charts are in the “What is MAER?” document on the Mill Street website (in the sidebar at right).
10 years in, 10 years out
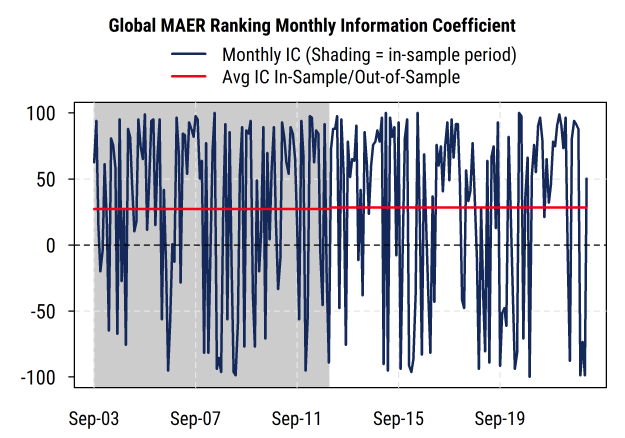
So I now look back and find that there has been about as much time since the model was built as there was historical data to originally test it on: about 10 years in-sample (2002-2012), and now 10 years out of sample (2013-2023), for a total of about 20 years of data to analyze.
It is well known in quantitative finance that predictors/factors/models for stock returns tend to show substantially weaker performance out of sample relative to the original in-sample testing (i.e., the “signal” captured by the predictor “decays” over time).
The biggest reason for this is typically over-optimization (overfitting) of the original model. That is, a predictor that was “overengineered” to fit a particular set of historical data turns out not to generalize as well on future (out of sample) data. I tried hard (and still do) to avoid that pitfall when building the model, but it is always difficult to be sure beforehand.
The other common reason is simply that after a predictor or model (or financial “anomaly”) is found and published, investors “price it in” and dilute or eliminate its predictive ability. As a simple example, if a study convincingly showed that stock prices always rise on Wednesday, then investors would see that study and start buying on Tuesday and selling on Wednesday to take advantage of it. Once enough people did that, stocks would then start rising on Tuesday and not Wednesday any more. So even if the original study was indeed valid, the excess returns it finds can be arbitraged away by investors who know about it and trade on it, thus reducing or eliminating the excess returns in the future.
In the case of MAER, the basic return drivers were already well known in 2012: earnings estimate revisions, price momentum, and valuation were all well studied and had been for many years at that point. Indeed, Robert Arnott’s 1985 paper “The use and misuse of consensus earnings” in the Journal of Portfolio Management was the primary impetus for MAER’s development at BBH in the early 1990s.
So one might assume that investors would have had plenty of time to arbitrage the efficacy of those factors away by 2012 (or by now). But the construction methdodology of MAER is unique not only because it combines mulitiple well-chosen indicators, but also because the underlying indicators themselves are built in a specific way. So the hope in early 2013 was that the underlying return drivers would continue to be effective, and the particular construction and combination of them used in MAER would enhance the results. The basic assumptions being:
- The behavioral biases that underpin stock selection factors like estimate revisions (fundamental momentum), price momentum, and valuation still existed and had not been arbitraged away
- That MAER could construct the indicators and combine them in a way that would extract the potential value in a robust way that institutional investors could use.
The big question
So the big question is: did the MAER ranking model hold up out of sample? With the usual caveats about backtesting, the short answer is yes.
While there are many ways to test a ranking model (and I have used many of those ways!), perhaps the simplest way is to look at the correlation between MAER’s ranking of the stocks each month and the subsequent average returns.
The “Information Coefficient”
That is, use the MAER rankings to assign stocks to 10 decile portfolios (most to least attractive) and then look at the returns of those decile portfolios (average return of all stocks included in that decile group) over the next month (or other holding period). If the top decile ranked stocks turn out to have the highest subsequent return, and the second decile is second best, and so on down to the lowest decile having the worst subsequent return, then the decile correlation would be 100%. If the reverse were true and the top ranked stocks turned out to be the worst performers (and lowest ranked the best performers, etc.), then the correlation would be -100%. If there is no correlation between ranks and returns, then the correlation would be zero. This correlation between ranks and future returns is known as the “information coefficient”, or IC.
If the ranks were in fact just random noise, then we would expect the correlation to be near zero on average over time, while allowing for randomness in the data. A positive average correlation means the ranks do predict future relative return to some degree, and so the questions then are: is the average correlation positive, and if so, how positive and how likely is it that the result is just random luck rather than a true relationship?
So for MAER, the basic questions I was looking to answer are:
Is the correlation between ranks and returns in the last 10 years (out of sample period) positive?
And if so, is it anywhere near as positive as it was in the in-sample period, or has the model’s efficacy deteriorated substantially since it was launched?
The answers I found:
Yes and yes.
The average correlation between the model’s decile ranks and future one-month returns for the global stock universe for 2003-2012 (112 months of in-sample data) is 27.2% (solidly positive), with a Newey-West corrected t-statistic of 3.9.
As those familiar with statistics know, the t-statistic accounts for the variability in the data to estimate the chances that the result was the result of random noise or not. The Newey-West correction for autocorrelation adjusts for the possibility that the monthly observations are not entirely independent (which would breach an assumption of the underlying statistics), and essentially reduces the t-statistic (makes it harder to indicate statistical significance) if it finds autocorrelation in the data.
Note: t-statistics above 1.96 are typically considered significant (less than 5% chance the true number is zero, or random noise), and above 2.58 highly significant (less than 1% chance the true number is zero), so a reading of 3.9 suggests it is extremely unlikely that the results were driven by chance alone. So the in-sample results through 2012 were indeed strong and significant, though one would expect that (otherwise the model probably wouldn’t have been released!).
Now the key point: The average correlation for the 122 months from January 2013 to present is 28.4%, with a t-statistic of 4.0.
This means that the correlation between ranks and returns, and the statistical significance, is both strong and essentially the same in both the in-sample and out-of-sample periods, a favorable result that surprised even me somewhat.
For the full 234 month history (combining in-sample and out-of-sample to get the most statistical power), the average information coefficient is 27.8%, with a t-statistic of 5.6.
Even though the data is always updated monthly (or more frequently in recent years) and that is how it was tested originally (monthly rebalancing, with a conservative 3-day reporting lag), as a check we can look at the correlation between ranks and returns over the subsequent three-month periods (i.e., assuming you close your eyes and hold portfolios for three months no matter what happens). There we find that the average correlation for the full sample is 15.4%, with a solid Newey-West adjusted t-statistic of 4.1.
Perhaps an even simpler way to look at it is: what are the odds that the information coefficient is positive in 85 of the 122 out of sample months, as the results show? If it were random (coin flip) we would expect about 61 positive IC readings in 122 months (50%), with a standard deviation of about 5.5, and so the odds of randomly seeing 85 are less than 0.1% based on standard binomial distribution results.
MAER has held up well out of sample, and was built with a focus on robustness
Without going into excessive statistical analysis, we can say that for the global stock universe, the out-of-sample performance of the MAER rankings has held up remarkably well, especially given all the “unprecedented” events of the last 10 years in markets, and has proven itself fairly robust.
This was very much the original goal when I constructed it: keeping the number of model parameters as low as possible, and sharply limiting the scope of parameter testing, in order to make the model as robust (and understandable) as possible. The general weightings of the factors (50% for estimate revisions, 30% for price momentum, and 20% for valuation) were consistent with both the original concept of MAER (a focus on the direction of estimate revisions, corroborated by price momentum and valuation) and the relative importance that they had in my research and how clients used it (e.g. intermediate-term indicators got more weight than short- or long-term indicators to align with the 1-6 month time horizon most useful to clients).
That is, the indicators and weights were not chosen because I tested thousand of possibilities and picked the best results, but were largely driven by the concepts behind MAER, considerations such as risk management and turnover (e.g. short-term price mean reversion often looks good on paper, but has too much turnover to be practical for most of my clients), and practical knowledge such as the quarterly earnings reporting cycle (driving, for example, the 100-day lookback period for which estimate revisions are included).
No model is perfect (a 28% correlation is strongly significant but far from 100%!), including MAER, and I have more recently found additional ways to potentially improve results with dynamic factor overlays or top-down risk-based timing tools to help manage better during turbulent times when MAER (and most models) tend to show weaker performance.
And I am aware that using a correlation coefficient as a test is somewhat different than using a traditional backtest (i.e., the hypothetical cumulative value of $100 invested using trading rules based the model readings). For the purposes of this post, however, the simplicity of the information coefficient helps answer the question more directly, as it uses all of the ranking information rather than just the extreme top and bottom, avoids the need to choose and test various trading and portfolio construction rules, and is easier to test statistically. But information coefficients like these would be more than sufficient to generate outperformance when building portfolios.
While few clients use MAER exclusively as the sole driver of their portfolios, the results appear to be sufficiently robust over time that one could do so. The many additional backtests I have done corroborate the results found using the information coefficient, some of which are included in the MAER background slides provided to prospective clients, and clients can (and do) request any sort of backtest they would like to see.
These results are very encouraging to me, and hopefully are of interest to those familiar with these types of equity selection models. I also hope they help make current and prospective clients more comfortable with both MAER itself and the processes I use in model building in general.
As always, institutions (large or small) interested in more information are welcome to reach out to us at info@millstreetresearch.com or via the contact form on the website.