18 November 2021
One of the themes in our sector/style work recently has been to tilt somewhat more toward Growth over Value and Cyclical areas within the US market.
Why? Three key factors support Growth over Value, while one remains a concern.
- Our bottom-up aggregated earnings estimate revisions trends continue to favor Growth
- The relative performance trend has been shifting back to Growth over Value
- However . . . relative valuation of Growth versus Value remains stretched versus historical norms, though the interest rate backdrop is arguably a structural reason for that
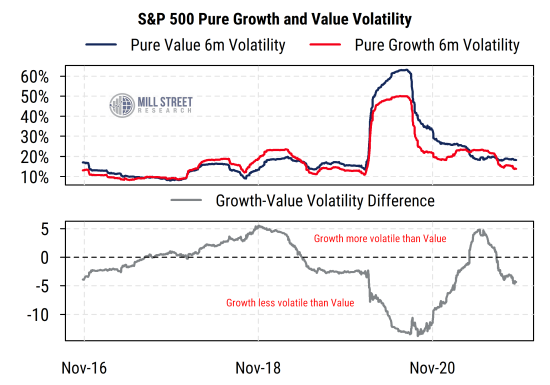
- Also, the relative risk (volatility) differential of Growth vs Value has moved back in favor of Growth (i.e., Growth is now less volatile than Value on a rolling six-month basis).
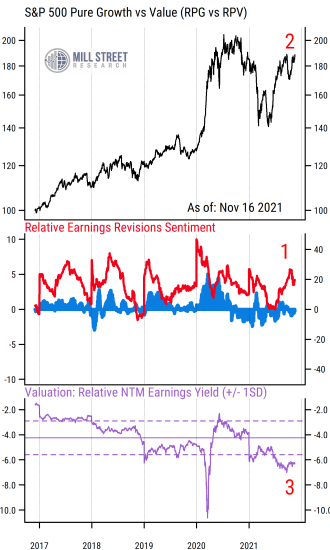
The first chart below shows our five-year historical data on the relative returns, revisions, and valuation for the S&P 500 Pure Growth index versus the S&P 500 Pure Value index (represented by their respective ETFs, with ticker symbols RPG and RPV). The “Pure” versions of the S&P 500 style indices include only those stocks whose mathematical Growth/Value scores (based on a complex algorithm created by S&P) are sufficiently decisive to consider them entirely “Growth” or entirely “Value”. Some stocks in the S&P 500 have characteristics of both styles and thus appear in both standard Growth and Value indices with differing weights, so those “mixed” stocks are not included in either of the Pure style indices. Using the pure style indices thus gives us a clearer picture of the relative performance and indicators of the two styles.
 Source: Mill Street Research, Factset
The first key support for Growth is that relative revisions activity, reflected in the middle section of the chart (marked by the number 1) is solidly in favor of Growth (above zero) and has been moving in that direction in recent months. Growth stocks almost always have more positive estimate revisions than Value stocks (almost by construction), but the differential varies over time. Right now it is clearly in favor of Growth in our view.
The relative performance, shown in the black line in the top section (marked number 2) has recovered much of the relative weakness seen from late last year to the middle of this year, and has recently moved back up to 12-month highs. This suggests that relative performance has regained momentum in favor of Growth, which would potentially be a resumption of the long-term (5+ year) trend that has favored Growth over Value.
The purple line in the bottom section highlights the ongoing concern about Growth vs Value: relative valuations. It plots the difference in the forward (next-12-month) earnings yield between the Growth and Value indices (based on the aggregation of their respective constituents), with negative numbers indicating Growth having a lower earnings yield (more expensive) than Value. While Growth stocks are (by construction) always more expensive than Value stocks, the current differential is particularly wide by historical standards, making Growth especially expensive versus Value. Is this valuation gap justified? Possibly, if one assumes much stronger relative earnings growth for Growth stocks, and/or looks at the low interest rate backdrop as making Growth stocks structurally more attractive. However, either way it is hard to argue that Growth stocks are attractively valued in a historical context, so that is a concern on a longer-term basis.
The final point we make in Growth’s favor is that Growth has returned to being less volatile than Value, based on each index’s rolling six-month annualized volatility. As shown in the second chart below, the two indices have taken turns over the last five years being the more volatile one, and earlier this year Growth stocks had higher volatility than Value stocks (grey line above zero). But most recently, as market volatility overall has declined, Growth volatility has declined more than Value, so investors considering relative price risk may favor Growth stocks now.
 Source: Mill Street Research, Factset
While many other factors affect style performance, these trends would argue for a bias toward Growth over Value in our view, though recent behavior suggests that the ride could still be bumpy in the shorter-term.