14 October 2021
As Q3 earnings season gets underway, stocks in the Financials sector are in focus as they are typically among the first to report earnings. While history indicates companies are on average likely to beat Q3 estimates, our indicators, which have been supportive for Financials all year, are now starting to weaken and suggest it might be time to take profits in the sector and reallocate to other areas.
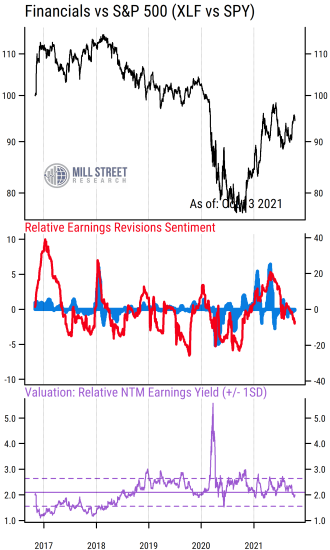
The chart below shows our key indicators for the S&P 500 Financials sector ETF (ticker XLF) relative to the broad S&P 500 Index ETF (ticker SPY). Since the performance and fundamentals of many sectors often move together, we typically focus on the relative performance, earnings trends, and valuation of a sector versus the overall market to identify potential outperforming or underperforming areas.
 Source: Mill Street Research, Factset
The top section of the chart plots the relative performance of XLF vs SPY, with a rising line indicating outperformance by Financials. We see the major trends of the last five years: underperformance by Financials from 2018 through much of 2020 (especially in the first wave of COVID turmoil last year), and then a sharp reversal in relative performance starting last November (when the Pfizer vaccine was first announced), followed by consolidation and most recently a renewed bout of outperformance.
The middle section is the key element in much of our work, as it tracks the “fundamental momentum” of the sector relative to that of the broader US market. The red line plots the net proportion of Wall Street analysts who are raising their earnings forecasts for companies in the Financials sector relative to the net proportion who are raising forecasts for the broader list of S&P 500 companies. In this chart each stock’s revisions ratio is cap-weighted (larger companies get more weight) in the aggregate as these ETFs are cap-weighted.
So when the red line is above zero, it indicates analysts raising earnings estimates more broadly in Financials than in the overall market, and below zero indicates a weaker earnings trend on a relative basis. The blue bars are similar, as they aggregate the month-on-month percentage change in forward 12-month estimates for each company (again showing Financials average estimate change relative to that of the S&P 500).
The message is that Financials are no longer seeing stronger estimate revisions than the broader market, as the red line and recent blue bars are now below the zero line. This recent pattern contrasts with the black line at the top, which shows Financials have outperformed recently. This divergence between relative revisions and relative returns has meant that stock prices in Financials have moved ahead of earnings, a potential warning sign. This has also had the effect of causing relative valuations to deteriorate.
The bottom section (purple line) shows the relative forward earnings yield (expected earnings as a percentage of current price) for Financials versus the broader market. Higher readings indicate Financials being cheaper (higher earnings yield) than the market, while lower readings show Financials being more expensive. The solid horizontal line is the five-year average, and we see that the latest readings are now below that average, signaling Financials being somewhat more expensive than average vs the S&P 500.
Either Financials earnings estimates need to improve significantly soon to catch up to recent relative performance, or relative performance is likely to weaken (unless Financials just get progressively more expensive). Given the recent outperformance by Financials and their deteriorating relative valuations, the slowing fundamental momentum argues for a more cautious approach to the sector in our view.