26 January 2022
Equities, and asset prices in general, have seen a return of volatility during January, following over a year of very subdued volatility and strong returns. Why, especially in a historically favorable seasonal period? In our view, markets are adjusting to the indications of moderately tighter monetary and fiscal policy following a period of extraordinary support from both US macro policy drivers. Investors are debating whether policy makers will be able to reduce stimulus and inflation pressures without provoking excessive economic weakness, and this debate is showing up as volatility in markets.
Macro uncertainty is provoking volatility
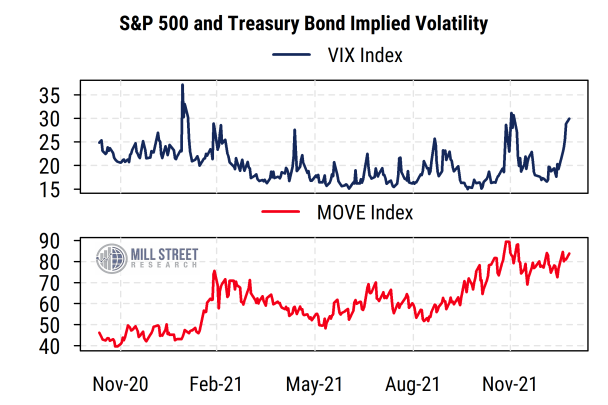
Higher volatility is not exclusive to the equity market. The widely-watched VIX index of expected S&P 500 index volatility has jumped again, with readings near 30% recently. The corresponding measure for the Treasury bond market is the ICE/BofA MOVE index, a measure of one-month implied volatility derived from options on Treasury bonds. The MOVE index has also been rising as bond prices have been more volatile recently in response to the same monetary and fiscal uncertainty. Because volatility is often persistent in the shorter-term, we may continue to see wider swings in asset prices as investors adjust portfolios to adapt to the changing policy landscape.
Source: Mill Street Research, Bloomberg
Monetary: The Fed is moving to tighten in response to inflation pressure
As virtually everyone knows by now, reported inflation has jumped in recent months in response to supply chain constraints and elevated demand, especially for goods rather than services. This is a predictable response to the impacts of COVID-19 and the corresponding aggressive policy responses in both fiscal and monetary dimensions.
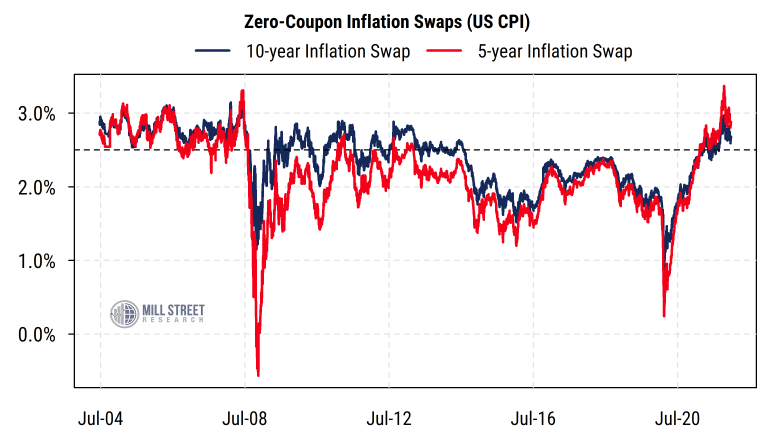
Institutional investors can bet on the level of future CPI inflation via inflation swaps, which pay a return based on inflation over the specified period in exchange for a fixed interest rate. The chart below shows the historical rates on inflation swaps for five-year and 10-year horizons. The horizontal dashed line indicates the presumed Fed inflation target, which is about 2% on the core PCE price index, and corresponds to roughly 2.5% on the CPI (the CPI tends to run about 0.5% above the PCE price index due to differences in construction).
 Source: Mill Street Research, Bloomberg
While current inflation is very elevated, longer-term inflation expectations have been above the Fed’s notional target recently, but not extraordinarily so, and are already starting to ease from their latest peak. Markets currently see CPI inflation averaging between 2.5% and 3% over the next 5-10 years (somewhat more near-term and less later), which is above the levels of the last decade but similar to readings seen for most of the 2004-2008 period.
In response to inflation worries and signs that the economy has largely recovered from the pandemic hit, the Fed has already begun the process of reducing its bond buying (QE) program, with plans to end it by March. It is then expected to begin raising its policy rates, with three or possibly four 25 basis point rate hikes being expected in the next year. Looking further out (with the usual caveat that long-horizon policy forecasting is fraught with peril), markets expect policy rates to be around 1.5-1.7% two years from now.
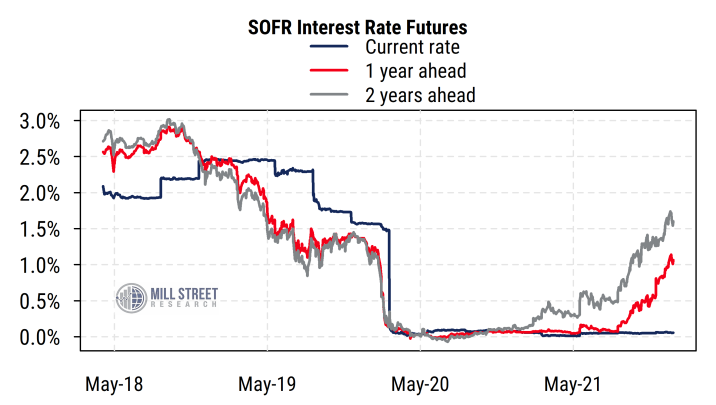
We can see this in the chart below, showing the futures prices for the SOFR (Secured Overnight Financing Rate) benchmark that is replacing LIBOR as the main overnight borrowing benchmark. The year-ahead rate is currently about 1%, while the expected rate two years from now is just above 1.5%. Like inflation, these expected future rates are well above the zero level seen since COVID hit in early 2020 but still well below the levels as recently as 2018. So Fed policy is set to tighten but is not likely to become heavily restrictive. Indeed, policy rates will likely remain below the inflation rate for some time. More immediately, investors are anxiously awaiting the FOMC announcement due today and the accompanying comments from Fed officials, looking for the latest clues as to the near-term policy path.
 Source: Mill Street Research, Bloomberg
Fiscal policy support has been extreme, but is slowing and could slow quickly
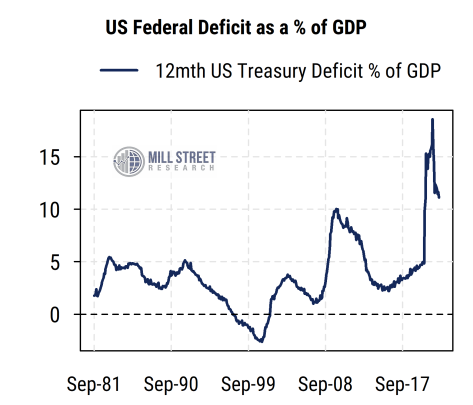
At the same time that monetary policy is shifting toward tightening, fiscal policy is also getting less supportive. A crude measure of fiscal policy is the US federal budget deficit as a percentage of GDP. The chart below shows that after hitting the highest levels in decades (in fact since WWII), the federal deficit has begun to come down as most COVID-related stimulus programs have ended and additional fiscal spending plans have been limited or have not been passed in Congress.
 Source: Mill Street Research, Factset
As of the end of 2021, the trailing 12-month deficit/GDP ratio at a little less than 12% is still above the peak level seen in the aftermath of the Great Financial Crisis in 2009 (about 10%). So fiscal policy, like monetary policy, is still quite supportive by historical standards, but is necessarily becoming less expansionary. Since markets often focus on the direction of movement, the question is the rate at which the fiscal contraction progresses and the eventual endpoint. The concern among investors is that fiscal policy could reverse too quickly and apply too much drag to the economy (which may face persistent supply chain issues) while the Fed is simultaneously raising interest rates. While the Fed is often viewed as being more technocratic and has established policy roadmaps, fiscal policy (via Congress) is harder to predict and to evaluate, leading to greater investor uncertainty.