21 July 2021
We have heard a number of client questions about the recent rebound in Growth stocks relative to Value (or Cyclical) stocks, so here we review some of the recent price action and one of the key cross-asset drivers.
The first chart below plots the relative performance of the S&P 500 Pure Growth versus Pure Value indices (top section) along with the 14-day RSI technical indicator (bottom section) as a measure of overbought/oversold conditions.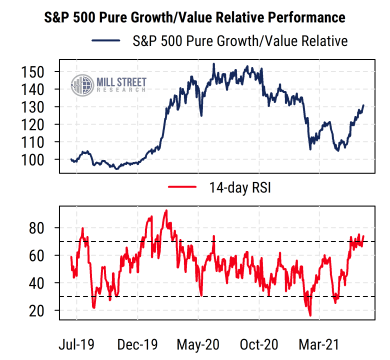 Source: Mill Street Research, Factset
Growth has certainly had a sharp rebound recently after months of underperformance versus Value. The move has been sufficiently sharp in the shorter-term to push the RSI indicator up to a level traditionally associated with overbought conditions (around 70 on the 14-day RSI), i.e., a move that has been “too far, too fast”.
These readings come not long after a pair of oversold readings in Q1 and Q2 of this year, and thus looks like a natural reaction to what had been a sustained move in favor of Value.
Our earnings estimate revisions indicators (discussed most recently here) tell us that the underlying fundamental momentum remains solidly in favor of Value/Cyclical sectors, which raises the question: what else may be causing the shift toward Growth?
The second chart offers one likely cross-asset driver. The performance of long-term Treasury bonds (proxied by the widely-watched iShares ETF with ticker TLT) has been remarkably correlated with the relative performance of Growth versus Value recently.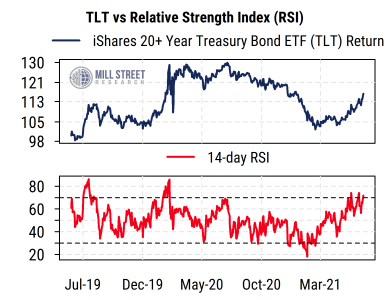 Source: Mill Street Research, Factset
Why? Rising bond prices (falling bond yields) are viewed as suggesting weaker economic growth or inflation and a flatter yield curve, which are potentially negative signs for the economically-sensitive Value stocks.
However, investors may be reading too much into the recent move in bond prices with regard to economic growth and cyclical stock fundamentals. Bond prices had fallen steadily for months until Q1 of this year, and then stabilized and have now rallied. We suspect this rally in bonds is at least in part for non-economic reasons (e.g. limited new Treasury supply, pension rebalancing, etc.), rather than purely due to expectations of a sharp slowdown in economic activity (or easier Fed policy, which can’t get much easier right now). And, much like the Growth/Value relative return, the RSI indicator for TLT is also at overbought readings, suggesting at least a pause if not a pullback growing more likely for both bonds and Growth/Value relative returns in our view.