23 November 2022
The focus of the inflation headlines, and most of the comments from Fed officials, has been on the year-on-year reported inflation rate of the CPI (or PCE). However, the extremely volatile macro environment has produced far more volatility in reported inflation data than has been seen for most of the last 30 years.
So while the reported year-on-year inflation rates in the CPI, PPI, and PCE remain quite high, the more recent trend shows a different picture. The last four months of data will start to capture the impact of the Fed’s tightening, which officially began in March and has since accelerated, along with supply chain improvements.
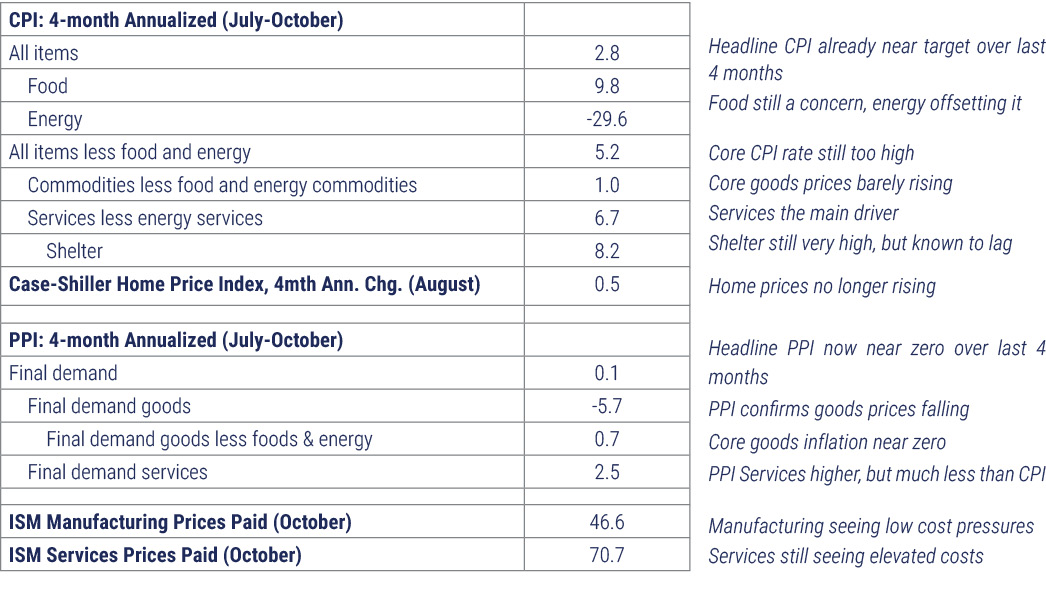
The table below therefore highlights the annualized rate of change in the indicated inflation-related data based on the last four months of data for each. The key points are:
- Overall CPI is already running at a 2.8% annualized rate over the last four months, close to the Fed’s target
- Overall PPI is already running at a 0.1% annualized rate – no wholesale inflation in the last four months
- Goods (or “commodities” in CPI) prices are flat (CPI) to down (PPI)
- Services prices are rising significantly faster, particularly in the CPI
- CPI Shelter (through October) is still very high, but Case-Shiller data shows home prices basically unchanged from four months prior, with data only through August
- ISM Manufacturing (i.e., “goods”) shows low Prices Paid at 46.6
- ISM Services shows Prices Paid still high at 70.7
Thus services (and food) are now almost entirely driving inflation, which are hardest to control with rates and often incorporate lags in the data.
Goods prices, including houses, though having less weight in the major inflation indices than services, tend to lead and are already flat or falling.
These recent data are likely a key reason why the market is “fighting the Fed” to some degree now with inverted yield curves and rising stock prices.
 Source: Mill Street Research, Factset, Bloomberg