In the longer-run, a key measure of inflation pressure is the amount of labor market slack (unemployed or underemployed people), which heavily influences the ability of workers to demand higher wages.
The standard reported unemployment rate data (i.e., the U-3 measure in the US) is useful in measuring labor market slack, but has limitations due (in part) to its definitions of “unemployed” and the “labor force” in the calculation: “unemployed” people as a percentage of the “labor force”. That is, to be counted as “unemployed”, a working-age person must be considered actively looking for a job (when asked if they have sought employment in the last four weeks in the monthly household surveys done by the Bureau of Labor Statistics, BLS). If they are not currently seeking employment for any reason, they are “not in the labor force” and thus do not count in the standard unemployment rate, even if they consider themselves unemployed.
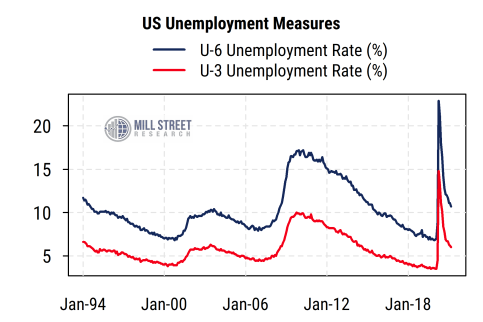
Another unemployment rate put out by the BLS, known as the U-6 measure, attempts to address this issue to some degree. The U-6 rate is much broader and includes anyone who has been looking for work within the previous 12 months but has been unable to find a job and has not looked for work in the past four weeks. It also includes anyone who has gone back to school, become disabled, and people who are underemployed or working part-time hours and want to work more. The first chart below plots the traditional U-3 rate and the broader U-6 rate since 1994. We can see that they typically follow a very similar pattern, but by construction the U-6 rate is always higher, and likely a more accurate description of slack in the labor market. What is more notable right now is that even after a dramatic recovery in employment from spring of last year (supported by historically large fiscal and monetary stimulus), the current U-6 unemployment rate of 10.7% is still higher than the worst reading of the 2001-02 recession, and far from the December 2019 low of 6.8%. By comparison, the current U-3 rate of 6.0% is likely understated (too optimistic) relative to the pre-COVID (Feb 2020) low of 3.5% due to measurement issues.
However, these metrics still rely on classifying people into various employment categories with somewhat arbitrary conditions. An even broader and simpler measure of unemployment can help address these issues, and may be a better overall metric of labor market slack: the employment/population ratio (often abbreviated as “EPOP”) among “prime age” people aged 25-54 is simply the proportion of all persons in that age range who are employed, regardless of whether they are actively seeking a job.
The second chart below shows the total EPOP ratio over the last 50 years in the top section, and the bottom section shows the breakdown between male and female EPOP readings. Even after a sharp rebound from last year’s extreme lows and a very strong employment report last week, the overall reading of 76.8% is still far from the recent “full employment” levels in the 80-82% range in recent decades. Note that the true level of “full employment” is unknown and possibly higher than previous peaks in this ratio. This pattern can be seen in the data for both men and women, with men having a downward drift in EPOP over time while women joined the workforce up until about 2000 and have then remained in a range about 10 percentage points below that of men.
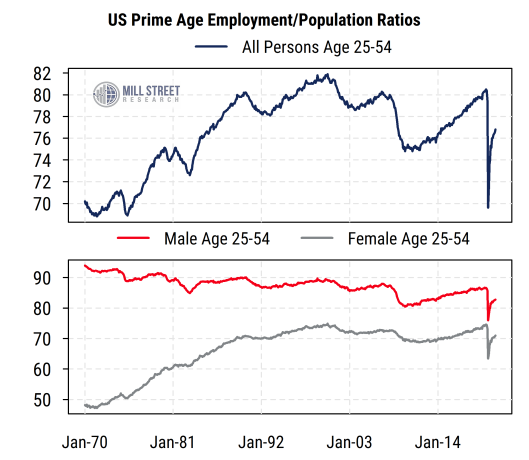
Because we are looking at people in the 25-54 age range, when adults are typically working, retirement and schooling should not have much impact on the ratios (as may be the case in the whole adult population). With a population of about 126 million in this age range in the US, the 4% difference in EPOP from current (76.8%) to previous peak levels (~80-81%) suggests five million or more people who are still unemployed potential prime-age workers. The average monthly gain in employment in this age group in 2016-2019 was about 86K/month, so even at an average of 100K jobs per month on a sustained basis it would take roughly four years to return to the previous peak. Further stimulus and a decisive suppression of COVID could accelerate that pace, but there is likely to be slack in the overall labor market for some time. This, in turn, suggests that labor cost-driven inflation is unlikely to accelerate on a sustained basis, beyond the short-term impacts from supply chain disruptions and re-opening.