Like many market strategists, the first question I tend to get is something like “What do you think about the market? Going up or down?”
Whether you are a professional investor tasked with navigating markets every day (most Mill Street clients), or an individual thinking about your own portfolio allocations, my first advice before giving any market opinions is always “have a plan”.
That is, one of the biggest mistakes investors make is to get carried away by what they happen to read in the headlines or hear from friends and make ad hoc decisions based on that, rather than a well-considered plan. The plan need not be complex or highly quantitative, but it should be clear and based on inputs or drivers that you have solid confidence in. This is typically where investment advisors can be most useful for non-professional investors.
My own approach to markets has long been reliant on objective models and indicators that can be analyzed and tested historically, along with a deep understanding of key fundamental relationships and influences, some of which may not be fully quantifiable. So I have spent a lot of time developing indicators and models to use as an anchor for my views, particularly the overall “risk on/risk off” outlook.
The Global Equity Risk Model
The Global Equity Risk Model is the primary driver of my market view over the next 1-3 months. It is a composite of eight individual indicators designed to forecast returns and risk for high-risk versus low-risk assets over the next one to three months. It was built with a focus on allocating between stocks and bonds, but other high-risk versus low-risk asset pairs typically follow similar patterns.
Each of the model’s eight indicators was designed and tested to capture a particular component of the market backdrop that has historically been useful for 1-3 month forecasting. Each indicator is set up to generate a percentile (0-100%) reading, with 100% being the most favorable for high-risk assets. The final model reading is an equally-weighted average of the eight percentile scores.
High indicator readings tend to forecast both higher returns and lower volatility for risky assets. As you will see below, the eight indicators are comprised of four equity market-derived indicators and four cross-asset indicators from fixed income and commodity markets.
While the underlying calculations for the indicators can be somewhat complex, the basic underlying ideas are fairly straightforward:
- Markets have a tendency to trend in the short/intermediate-term, so we want to stay in line with the prevailing trend most of the time. This is true both for price direction and for volatility (i.e., volatility tends to be persistent over 1-3 month periods).
- The economic and interest rate backdrop is important, but has to be analyzed correctly. Monthly economic reports are often much less useful than people think, while forward-looking market-based indicators tend to be more helpful.
What would the model consider the most favorable scenario?
- Strong intermediate-term equity price trends, led by higher-volatility stocks, with moderate/falling volatility readings.
- Narrowing credit spreads (indicating less corporate credit risk).
- VIX (implied volatility) readings that show favorable contrarian positioning by traders (i.e., not overly optimistic about near-term volatility).
- A trend in expectations (based on short-term Treasury yield spreads) toward more supportive Fed policy, either rate cuts or fewer rate hikes.
- Low real bond yields in the past 12-18 months that will support economic activity now.
- Outperformance of industrial metals (copper, aluminum, nickel, etc.) versus precious metals (gold, silver) as a measure of global industrial/economic growth.
The reverse conditions would be unfavorable for the 1-3 month outlook.
Our research indicates that model readings above 50% are net bullish for equities, and readings above 60% have been most reliably bullish in our historical testing. Readings below 50% call for caution as they tend to be associated with higher volatility, while readings below 40% have been associated with poor returns and high volatility in equities.
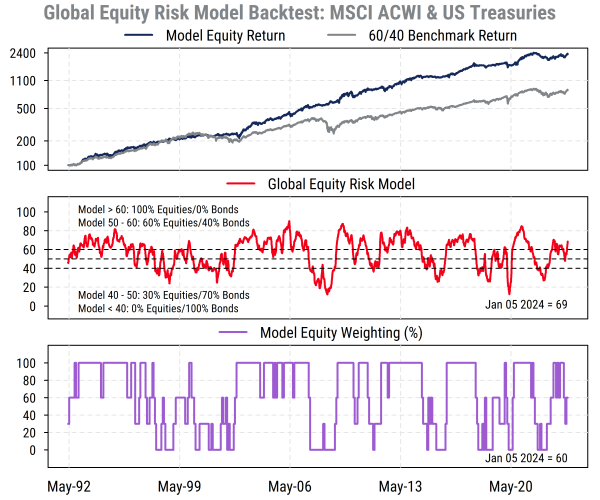
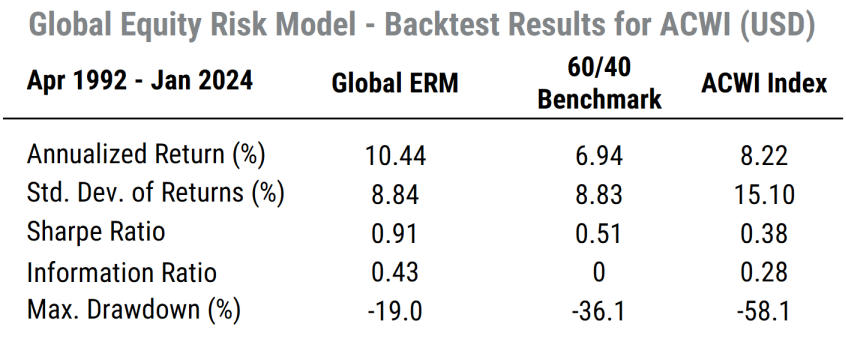
The model backtest
The chart and statistics below reflect a simple hypothetical allocation strategy between stocks (based on the broad MSCI All-Country World Index, or ACWI) and Treasury bonds (ICE/BofA US Treasury Index) based on the level of the model reading each month (as indicated in the middle section of the chart). The results include assumed transaction costs of 30bps per 100% portfolio turnover. The benchmark is a fixed 60% stocks/40% bonds portfolio. The study results indicate that the model portfolio would have outperformed the 60/40 benchmark by a notable margin with the same risk, and also outperformed the ACWI itself (which is significantly more volatile than the 60/40 portfolio).
Note: results shown are hypothetical and do not reflect any actual trading. They do not include considerations such as taxes, fees, or liquidity and investment decisions should include other inputs. Past performance is no guarantee of future results.
Source: Mill Street Research
Ok, so what are the indicators?
The eight indicators in the Global Equity Risk Model are listed below with a brief explanation of each.
All indicators are constructed as rolling percentiles based on the level of the underlying indicator within its recent (generally two- to five-year) range, which means that the indicator readings are constructed to avoid look-ahead bias (i.e., what is “high” or “low” for an indicator is based only on information known at the time) and adapt to longer-term shifts in their respective ranges.
1) Global Equity Volatility Indicator: this indicator uses a combination of recent historical (roughly six- to 12-month) volatility measures based on daily returns of the MSCI ACWI index to forecast future equity market volatility and returns.
2) Global Risk Appetite Indicator: this indicator uses returns of our own index of global stocks that rank in the top decile by volatility as a measure of investor risk appetite. Shorter-term averages of the high-volatility stock index are compared to longer-term averages to capture inflection points and intensity of investor behavior among the riskiest stocks.
3) Global Momentum Indicator: this indicator uses rolling calculations of risk-adjusted returns (returns relative to volatility) for the MSCI ACWI index to gauge both the strength and riskiness of the intermediate-term market trend.
4) Global VIX Divergence Indicator: this indicator uses the difference between option implied future volatility and recent realized volatility as a contrarian measure of short-term investor sentiment. It uses a combination of US VIX (S&P 500 Index) data and the European VSTOXX (Stoxx 50 Index) data to capture global influences.
5) Global Credit Risk Indicator: this indicator uses changes in the option-adjusted credit spreads on global Baa-rated corporate bonds as a measure of whether credit conditions are improving or deteriorating. Widening credit spreads have tended to signify increased risk for equities, while narrowing spreads tend to be a favorable sign for equities.
6) Fed Expectations Indicator: this indicator uses the spread between US two-year Treasury note yields and three-month Treasury bill yields as a proxy for market expectations of future Federal Reserve interest rate policy. A widening spread suggests increased expectations of Fed tightening (higher future US short-term rates), which has been associated with increased risk to equities globally, while a narrower spread (i.e., expectations of looser Fed policy) has been associated with reduced risk to equities.
7) Global Real Yield Indicator: this indicator is based on lagged readings of a composite of US, UK and German 10-year government bond yields adjusted for each country’s longer-term inflation rate. Changes in real bond yields tend to impact economic and earnings activity with a lag of 12-18 months, with higher global real bond yields typically followed by increased equity market risk 12-18 months later, and lower real yields followed by reduced risk.
8) Global Metals Indicator: this indicator uses a combination of industrial metals and precious metals prices as a gauge of global economic growth and inflation. When industrial metals prices (often driven by economic demand) are rising faster than precious metals prices (often driven by inflation or geopolitical worries), it has tended to be a favorable sign for global growth and equity returns, while the reverse tends to be negative for equity returns.
The inputs to the model indicators are almost all market-derived data, the only exception being the long-term inflation rates used to estimate real global bond yields. Four are primarily equity market-based indicators, while the other four are based on fixed income or commodity data. Consequently, we can largely avoid the issues associated with using economic data in timing models (i.e., lags and revisions) and capture timely, forward-looking messages about the global economy and expectations by using data from multiple global markets.
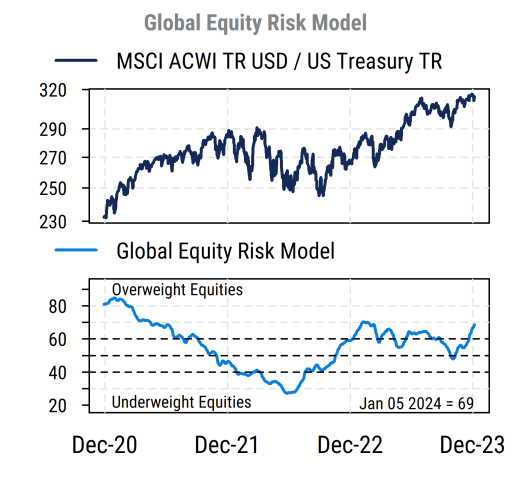
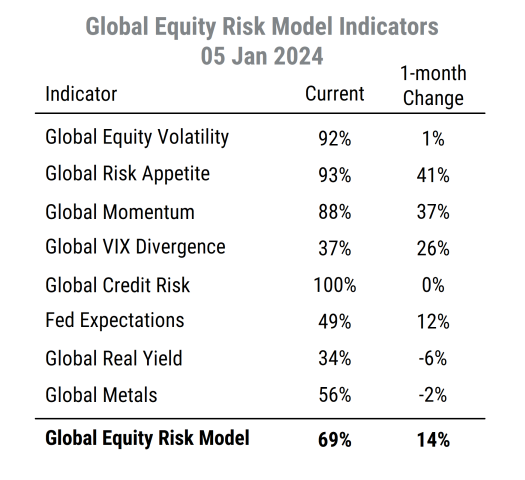
What does the model say now?
The current model reading of 69% (as of this writing) is solidly in the bullish zone above 60%, and spent most of 2023 in bullish territory. The biggest positives are the equity momentum and volatility measures as well as the credit indicator. The Real Yield, Metals, and Fed indicators are mixed or unfavorable, while the contrarian VIX indicator was unfavorable but improving now.
Source: Mill Street Research
This model has been crucial in keeping us on the right side of the market trends in the last few years, but no model is perfect (don’t let anyone tell you otherwise!), and any model should be used as a guide, not a guru.
The broader point, though, is that even if you do not use the Mill Street model, you should have some objective framework for helping to decide how to allocate your investment portfolio. Making purely subjective judgements based on how things “feel”, what you are “hearing from people”, or your political views tends to produce unfavorable results in my experience.
Mill Street institutional clients have full access to this model and all the others. Investors interested in regular updates of the Equity Risk Model along with some commentary and weekly stock ideas can subscribe to the Weekly Roundup report via the website. Reach out at info@millstreetresearch.com for more information about the product suite.
Sam Burns, CFA
Chief Strategist