One of the big questions every investor has to wrestle with in some way or another is whether their own expectations differ meaningfully from what the “market” (investors in aggregate) expect. Only when results differ from consensus do markets make significant moves. But how do we really know what the “consensus” is?
What the market expects vs what you expect
Of course, we first have to specify “consensus for what”? Since one of the most common questions I get as a market strategist is “is the US stock market over- or undervalued?”, I will start there.
Before saying the stock market is over- or undervalued, we also have to specify “relative to what?”. Typically, investors are asking whether stocks are over- or undervalued relative to the standard alternatives of bonds or cash, but can also mean relative to other assets. Since allocation between equities and fixed income is among the most common key allocation decisions, I take the question as “how are stocks valued relative to bonds?”
Historical averages are not enough
However, the question of valuation is often taken simply relative to historical averages of some kind (i.e., stocks relative to their own history, not any other asset). For many years now, I have taken the view that assessing market valuation is not just a matter of comparing a current P/E (or any price-to-fundamental) ratio with historical averages. The same is true for bond yields: just because yields were higher or lower in a past period does not necessarily mean they will go back to that level.
While equity P/Es or bond yields do have some mean-reverting tendencies over long periods of time, those periods can be very long, and thus not particularly useful for asset allocation purposes. In my mind, the P/E or yield on an asset is a function of conditions at the time and investor expectations, so they must be evaluated as such. Investors must decide which is best among the options available to them right now, not the options they wish they had based on what they see in the past. So the assumption that the long-run average of a P/E or yield is “fair value” has not been useful in my view, though some still rely on essentially that assumption.
If you are investing today, like many investors you need to decide between stocks, bonds, and cash (and potentially other assets) based on current forward-looking projections, not conditions that were seen in the past but may not repeat over your investment horizon.
For stocks vs bonds, long-run growth is the key
To me, the key to looking at stock/bond relative valuation is to start with the fundamental distinction between stocks and bonds as asset classes: stocks participate in economic growth via earnings growth, while bonds do not. Consequently, whether stocks outperform bonds over a longer time period depends significantly on economic and earnings growth. More specifically, stocks tend to outperform bonds when economic and earnings growth is relatively strong, or better-than-expected. Weak or negative growth (recession) favors the stability and fixed payments of high-grade bonds over potentially weak or declining earnings for public companies, given the higher risk of equities compared to bonds.
With this as a backdrop, the key question in my view is “what level of long-run growth is the stock market currently expecting, and how does my own view differ from that?” This question reflects the importance of comparing my view with the market’s, and the long-run nature of stock market valuation (since stocks are long-duration assets with no fixed terms).
Years ago I built a model to help address this question objectively. I call it the Implied Growth Model, because I am estimating the level of long-run future real earnings growth being implied by current market prices, earnings, inflation, and economic backdrop. Using real (inflation-adjusted) earnings is important because investors are interested in real returns and real growth, so we compare real growth and real bond yields rather than nominal yields and growth.
This distinguishes the model from survey-based data in which investors or economists are polled to try to directly determine their growth expectations based on what they say. While such surveys can be useful in some respects, they often contain less information than market-based indicators. This is because they may not be timely, may be asking the wrong people (i.e., not the people actually making investment decisions), asking the wrong questions (i.e., for near-term nominal growth, or other less relevant variables), or those responding may give answers that do not align with their actual investment views.
A tool to answer a specific question: the Implied Growth Model
The Implied Growth Model is meant to objectively answer the question of what investors expect for long-run real earnings growth based on what they are doing (market pricing) rather than what they say. With that estimate in hand, I can then decide whether market expectations seem too high, too low, or about right. And while finance textbooks say that investors understand that stock valuations should be based on long-term growth expectations and discount rates, in reality investors price stocks and bonds based on what they see happening currently or in the near-term (investor myopia). This means valuations and asset prices move around (are more volatile) than they “should” be under textbook assumptions. The result is that implied future growth rates move around more than you might expect, and this can offer investors opportunities to take advantage of potential mispricings.
How does the model work?
The process for estimating the market’s implied long-term real earnings growth rate is based on valuation theory and is relatively straightforward but involves several steps.
The fundamental idea is that the expected real (inflation-adjusted) return on equities should be equal to the expected real return on corporate bonds of similar risk plus an additional risk premium due to the higher risk of equities relative to bonds (i.e., equity’s lower position in corporate capital structure).
Therefore we use the following relationships:
- Expected real return on stocks = expected real return on bonds + risk premium
- Expected real return on stocks = current mid-cycle earnings yield + expected real earnings growth
- Expected real return on bonds = current yield on long-term Baa-rated corporate bonds minus expected inflation rate
So to calculate the expected real earnings growth we need to estimate four values:
1) the current mid-cycle equity earnings yield,
2) the current yield on corporate bonds,
3) the expected inflation rate, and
4) the equity risk premium over corporate bonds.
The current yield on long-term Baa-rated corporate bonds is readily available every day, so that one is easy. Note that the model uses corporate bonds rather than Treasury bonds (as many other models do) because they should be more comparable to stocks. The average S&P 500 company has a debt rating of Baa (BBB), so we use Baa-rated long-term bonds (since stocks are long-term assets) as the comparison. Thus the corporate bond yield will include a time-varying credit risk premium relative to risk-free Treasuries automatically within it, and the risk premium we estimate in the model will be for the additional risk of equities over corporate bonds.
The other inputs are a bit more involved, so I will just summarize them here. Of course, there are other ways of estimating these figures, but I found these have reliable long-run data back to the 1960s-70s, and make sense intuitively.
The “mid-cycle” or normalized earnings yield on the S&P 500 is estimated based on the trailing 10-year average (10 years presumably encompassing a full earnings/economic cycle) of S&P 500 earnings, which is then adjusted for inflation to current dollars. This is similar to the methodology used by Yale finance professor Robert Shiller, among others. The idea is that earnings are highly cyclical, so we want to avoid using current-year earnings which may be near a peak or a trough in a cycle, and thus not reflective of the longer-term (normalized) earnings level that investors actually see as the sustainable level.
The earnings yield is simply the normalized earnings divided by the current index level of the S&P 500 (E/P, or the inverse of a P/E).
The expected inflation rate is estimated based on the trailing 12-month average of core PCE (Personal Consumption Expenditure) inflation, which is the figure the Fed focuses on and one of the better inflation estimates available. The assumption is that investors extrapolate recent inflation rates into the future, which often aligns with survey-based data but is available at higher frequency and with more historical data. Market prices from inflation-protected bonds or inflation swaps can also be useful but have much more limited history and can be affected by market liquidity.
The equity risk premium for stocks relative to corporate bonds is estimated based on the economic backdrop. We use the growth rate of the US Leading Economic Indicators (LEIs) as a proxy for investor perceptions of whether the economy is weakening or improving. A low or negative growth rate produces a higher equity risk premium (higher risk to stocks in periods of weaker growth), and vice versa. The assumption is that investors seeing potentially weaker growth reflected in leading economic indicators will demand a higher risk premium (higher yield, or lower P/E) to own stocks rather than bonds, all else equal.
For anyone who has looked at risk premia calculations, it is important to note that the risk premium here is not based on any asset’s returns or on valuations, as those would potentially produce circular results in a model like this, but on underlying economic conditions.
Each of these values has long-term data available and can thus be calculated historically without any forecasts or qualitative assessment required. We can then estimate the long-run future real earnings growth rate by the following relationship:
Expected real earnings growth = Baa bond yield – inflation – mid-cycle equity earnings yield + equity risk premium
In other words, we want to estimate what level of real earnings growth an investor would need to expect in order to make them indifferent between owning stocks or bonds at current market prices (given the model’s assumptions).
The chart below shows the various inputs to the model and the model results in the bottom section (green line). We can see that the level of implied growth has varied widely over the last 50 years, with negative readings in the high-inflation 1970s and extremely high readings near 8% in the stock market bubble period around 1999-2000.
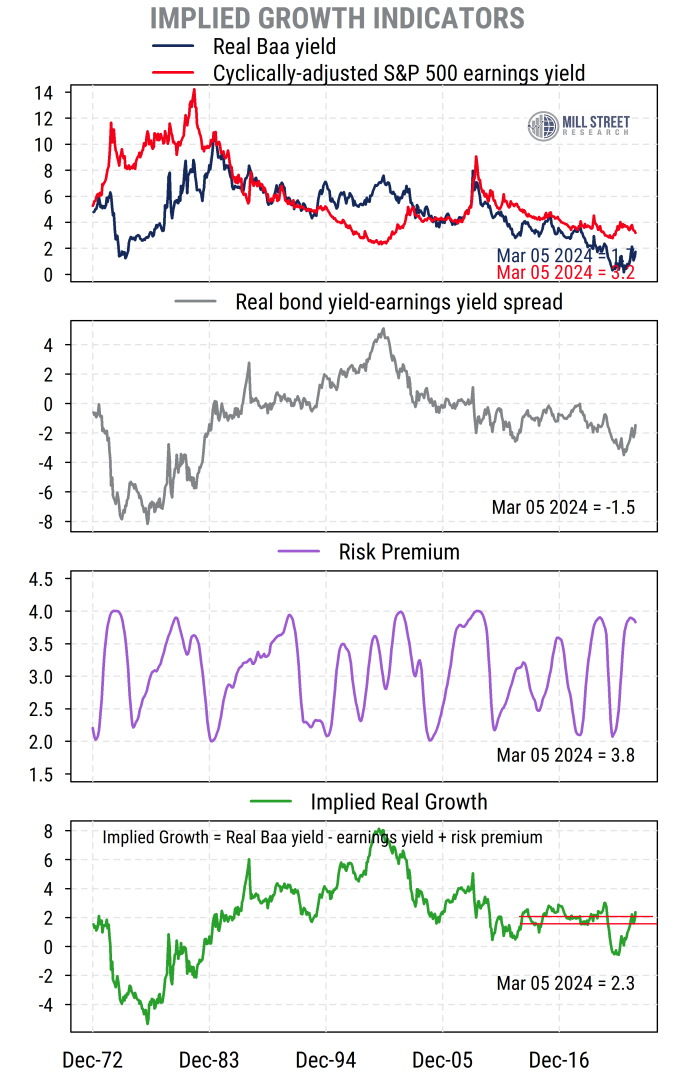
Source: Mill Street Research, Factset, Bloomberg
The basic interpretation is that higher implied growth tends to mean stocks are potentially overvalued relative to bonds, and low readings suggest stocks may be undervalued. But it does not tell you directly whether to buy stocks or bonds, as you must have in mind some view as to what “fair value” is based on current forward-looking conditions.
My own view in recent years is that the US economy could readily produce real growth in the 1.5-2.0% range, so that is my “fair value range” for the model now (horizontal red lines in chart). But in decades past, I may well have had some other fair value range in mind: the 1980s and 90s had higher real growth rates, while the 1970s were much weaker. For frame of reference, the rolling 20-year trendline growth rate of real S&P 500 EPS is shown in the chart below. It has ranged from nearly 0% after the 1970s/early 80s experience, and as high as 5% after the strong 1990s, and has been in the 3-4% range in recent years. So our 1.5-2.0% estimate may be conservative, unless recent years’ growth has been unusually high and is due to slow.
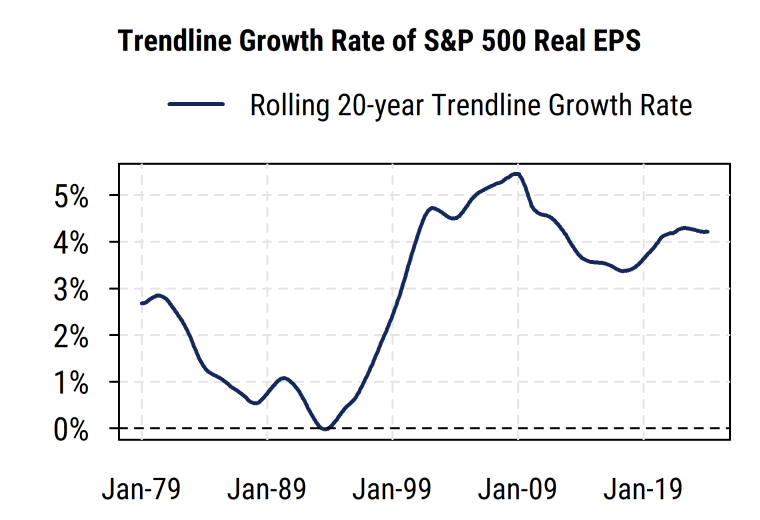
Source: Mill Street Research, Standard & Poor’s
What is the model telling us now?
The latest model reading indicates markets pricing in about 2.3% average annual real growth in S&P 500 earnings over the next 10-20 years. This is the highest reading on the model since mid-2021, as investors have had a relatively bearish view on economic growth since then, which is one reason I think stocks have done much better than expected in 2023 and so far this year.
Seeing low implied growth rates in the model was an important reason why I moved to an overweight stance on equities in November 2022 (once my tactical indicators started to show signs of improvement) and have been overweight ever since. For similar reasons, I have also been underweight in long-duration bonds even longer, since November 2020. I currently still favor cash (short duration) over long-duration bonds within fixed income.
Stocks no longer cheap, look more like fair value vs bonds now
So while 2.3% is the highest in nearly three years, it is only marginally higher than my 1.5-2.0% fair value range and far from excessive in a longer-term historical context. But as I often tell clients, you do not have to use my view on fair value, you can apply your own using the model reading as the “over/under” line.
That is, if you think long-run real earnings growth will be better than 2.3% in the coming years, then stocks should be more attractive than bonds (based on the model’s assumptions). If you think real earnings growth will be weaker than what the model says, then stocks will look overvalued relative to bonds.
In my view, stocks are closer to fair value relative to bonds now than they have been in a while, as stock prices are higher relative to earnings and real bond yields have risen significantly from earlier very low (negative) levels. But the net result has been to move from clear undervaluation for stocks to roughly fair value relative to bonds.
So valuation is more of a neutral influence on my longer-term market outlook now. The near-term view based on trend, momentum, and volatility along with expectations of Fed rate cuts this year, are the key drivers of my continued bullish outlook for stocks.
Sam Burns, CFA
Chief Strategist